
Abstract
Magnetic inductive heating (MIH) of nanoparticles (NPs) attracts considerable research attention, first because of its application to hyperthermia in biological tissues. Most reports so far have dealt with magnetite NPs with a Curie temperature, TC, of as high as above 500 °C. In this paper, we present results of a MIH study in an ac field of frequency 219 and 236 kHz and strength of 40–100 Oe for several samples of La0.7SrxCa0.3−xMnO3 NPs of TC in the region of hyperthermia, that is some tens of degrees above human body temperature. The particle materials were fabricated by a high energy mechanical milling method combined with calcining at various temperatures in the range of 600–900 °C. The heating temperatures of the samples were observed to saturate at a field irradiating time of less than 10 min and at temperatures ranging from 40 to 75 °C depending on the strontium content, the NP concentration, c, and the field parameters. A sudden change in heating rate was clearly revealed in several heating curves for the case of low applied field and low c, which was considered to be related to the onset of a strong decrease in zero-field cooling (ZFC) magnetization of NPs. The initial temperature increase slope, dT/dt, and the saturation temperature, Ts will be analyzed as dependent on the NP concentration. Field dependences of the specific loss power will be analyzed and discussed for various concentrations, c. Evidence of fluid viscosity influence will also be noted.
Export citation and abstract BibTeX RIS

Content from this work may be used under the terms of the Creative Commons Attribution-NonCommercial-ShareAlike 3.0 licence. Any further distribution of this work must maintain attribution to the author(s) and the title of the work, journal citation and DOI.
1. Introduction
When exposed to an electromagnetic wave of proper frequency range, several nanoparticles (NPs) can absorb the energy of the latter to generate heat to their surrounding media. This nanoheating phenomenon has recently attracted much attention, first because of its potential applications in biology and medicine [1, 2]. As for magnetic NPs, magnetic inductive heating (MIH) and its application to cancer hyperthermia has been known for over half a century. There are several mechanisms of energy loss that could contribute to the temperature increase in MIH [2–5]. For multidomain ferro- or ferri-magnetic NPs, the major heating contribution is based on hysteresis energy loss, for which the heat power generated during a magnetization loop is proportional to the loop area,

where μ0=4π×10−7
Vs(Am)−1 is the vacuum susceptibility, ρ is the specific mass and M
H
is the magnetization component parallel to the field. Based on (

where f is the frequency of the alternating magnetic field and χ ''(f) is the imaginary part of susceptibility, which in more detail is expressed as

where τ N is the Neel relaxation time, M s is the saturation magnetization and V is the volume of magnetic NP.
Besides the Neel loss, the other relaxation, called Brown relaxation, is related to the rotation of NPs as the whole in a liquid, for which the loss power P and the relaxation time τ B are described as


where η is the liquid viscosity and r h is the radius of the whole particle.
Experimentally, the MIH is described by a temperature increase versus heating time curve and the heating capacity is characterized by a parameter called specific loss power (SLP), which is proportional to the initial slope of the heating curve,

where C and m s are, respectively, the heat capacity and mass of the ferrofluid and m i is the mass of magnetic NPs.
Most of the reports on MIH studies have dealt with ferrous oxide magnetic NPs. Hiergeist et al [5] showed that for the superparamagnetic magnetite particles (NP diameter of around 10 nm) the specific loss power strictly follows square dependence on the field amplitude, whereas for the case of multidomain nanoparticles (diameter of several 100 nm), the dependence is of the cubic type. The dependence of SLP on the Fe 3 O 4 NPs concentration, c, has also been reported in several works [6–8] and it was indicated that the behavior is of the linearity type in quite broad ranges of concentration, c, namely c=0–50 mg ml −1 [7] or 0–100 mg ml −1 [8]. The demands of a fuse heating in hyperthermia application leads to a tendency to seek materials with a Curie temperature, T C , much lower than that of ferrous oxide, namely of some tens of degrees above human body temperature. Several research projects have recently been reported for the MIH studies of manganite NPs [8, 10–14]. In this paper, we present the results of a MIH study in an ac field of frequency 219 and 236 kHz, and strength in the range of 40–100 Oe for several samples of La 0.7 Sr x Ca 0.3-x MnO 3 NPs with focusing on the compositions of x=0.15, 0.20 and 0.25. As will be shown, the analysis of the temperature increase rate d T/d t in the whole heating time for a broad particle concentration range can reveal several specific characteristics of the MIH effect.
2. Experimental
2.1. Preparation of materials
Most of the manganite nanoparticle samples of La 0.7 Sr x Ca 0.3−x MnO 3 used in this study were prepared by reactive mechanical milling (RMM) using a high-energy milling machine (SPEX 8000D). The synthetic procedure of powder samples has been described in several of our previous reports [15–17]. The perovskite could be created after 4–8 h of milling the stoichiometric mixture of component powder oxides. In order to obtain stable crystallites of different nanosizes, the milled powder was then annealed at various temperatures in the range of 600–900 °C. For magnetic inductive heating experiments, the obtained powders were directly used to make ferrofluid without any press step like in the case of the samples for reported studies of electronic properties [9]. In this study, we will report results of MIH for samples obtained by a 'bottom-up' RMM method of manganite with Sr content of x=0.25, 0.20 and 0.15. The samples are denoted, respectively, as Sr.25/RMM/600–900 °C, Sr.20/RMM/600–900 °C and Sr.15/RMM/600–900 °C.
For comparison, we also used another approach to prepare manganite NPs, that is by using the same milling machine to mill bulk ceramic manganite that was previously synthesized by the conventional solid-state reaction method. This second procedure is abbreviated to SMM to distinguish it from the above RMM approach. The nanosize powder obtained by such a 'top-down' approach was then preceded by an annealing treatment similarly as for the case of the above described bottom-up procedure. For more details, see our previous report [17, 18]. The Sr content chosen for the fabrication of manganite nanopowder by this top-down method was x=0.15. This sample series is denoted as Sr.15/SMM/600–900 °C.
2.2. Characterization
The crystallite structure was determined by x-ray diffraction (XRD) using a SIEMENS D5000 diffractometer with Cu Kα radiation λ=1.5406 Å. Diffraction diagrams were recorded with step scans from 10 to 80° in a 2θ angle and 1 s for each 0.02 ° step. A commercial WIN-CRYSIZE program packet based on the Warren–Averbach formalism was used to determine the average crystallite sizes and crystallite size distributions of the nanosystems. The size and shape of the powder particles may be determined accurately using direct methods of field emission scanning electron microscopy (FESEM) on Hitachi S-4800 equipment. Magnetization measurements were carried out on a home made vibrating sample magnetometer in the temperature range from 77 to 400 K with field cooling and zero-field cooling regimes.
2.3. MIH experiment
A commercial generator (RDO HFI 5 kW) was used to create an alternating magnetic field of amplitude from 40 to 100 Oe at a frequency of 219 kHz (used for the SMM sample series) and of 236 kHz (for the RMM sample series). The induction coil has seven turns with 3 cm diameter and 11.5 cm length. Ferrofluids of given concentration were prepared as follows. Powder samples of weighed proper mass were dispersed in 1 ml of solvent, mixed for several minutes with a sonicator and kept in a round-bottomed glass holder. Except for one case 11 where oil was utilized, all other MIH experiments were performed for ferrofluids using distilled water as the solvent. A vacuum layer was used to insulate thermal exchange from the samples to the ambient medium. Temperature increases were measured on-line by using an optical thermometer (GaAs sensor, Opsens) with an accuracy of 0.3 ° in the range from 0 to 250 °C.
3. Results and discussion
3.1. Structural characteristics
Figure 1 presents the XRD patterns measured for seven samples of the whole range of strontium content, x=0–0.3, synthesized by the RMM method with annealing at T a =900 °C. As demonstrated, although all of the samples are of single phase, the crystal structure of the samples with x < 0.15 is orthorhombic and that of the samples with x⩾ 0.15 is monoclinic. We then chose samples of three Sr contents, such as 0.15, 0.2 and 0.3, in the monoclinic structure for further MIH investigations. In order to obtain NPs with various particle sizes, we also prepared three series of samples: Sr.25/RMM, Sr.15/RMM and Sr.15/SMM annealed at various temperatures in the range T a =600–900 °C. Figures 2(a) and (b) show the FESEM images of the sample annealed at 900 and 600 °C of the Sr.25/RMM and Sr.15/SMM series, respectively. The crystallite sizes of the NPs determined from XRD (110) and (220) peaks are gathered in table 1.
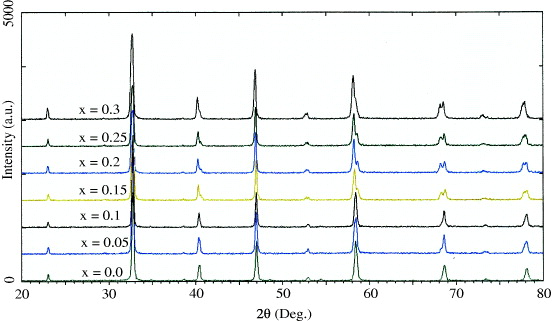
Figure 1 XRD of various powder samples of x(Sr)=0−0.3.

Figure 2 FESEM images of a series of samples: Sr.25/RMM annealed at 600 (a), and 900 °C (b); Sr.15/SMM annealed at 700 (c) and 900 °C (d).
Table 1. Particle size of NPs of Sr.25/RMM and Sr.15/SMM sample series.
| d XRD (nm): Sr.25/RMM | 13.1 | 16.8 | 25.1 | 31.7 | 41.7 | 81 |
| d XRD (nm): Sr.15/SMM | 24 | 33 | 40 | 53 |
As one can see, the crystallite sizes of the prepared NPs depend a little on the Sr content. The particle sizes of the samples with the same Sr content of x=0.15, fabricated by the RMM and SMM methods, are fairly similar to each other. When increasing the annealing temperature from 600 to 900 °C, however, the particle sizes increase monotonically, that is those of the Sr.25/RMM and Sr.15/SMM increase from 13.1 to 80 nm and 24 to 53 nm, respectively (table 1 and figure 2).
3.2. Variation of Curie temperature TC and onset temperature Tb,mag
Figure 3 presents the 100 Oe thermomagnetizations measured under zero-field cooling (ZFC) and field cooling (FC) regimes for three powder samples of Sr.25/900°, Sr.20/900° and Sr.15/900°. There is clearly a characteristic temperature, called T b,mag , below which the ZFC and FC magnetizations, M ZFC and M FC , diverge from each other. With increasing temperature, the ZFC magnetization increases monotonically in the range from 77 K to around T b . After that temperature, it turns to decrease very fast to zero at the Curie temperature T C . The estimated T C and T b,mag temperatures for the measured samples are shown in table 2. For convenience in further discussions of MIH results, the temperature values are given in Celsius instead of Kelvin. As one can see, the ranges between the two characteristic temperatures are of about 20 °.
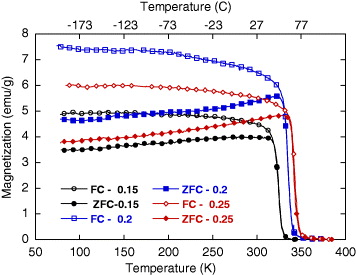
Figure 3 ZFC and FC magnetization versus temperature for powder samples of various Sr content annealed at 900 °C.
Table 2. Characteristic temperatures for samples of various x annealed at 900 °C.
| T C (°C) | 55 | 67 | 74 |
| T s -100 mg (°C) | 52 | 65.5 | 73 |
| T b,mag -100 mg (°C) | 39 | 47 | 55 |
| T b,heat -100 mg (°C) | 31 | 37 | 43 |
3.3. Heating curves
The temperature versus heating time measured in the field of 80 Oe and 236 kHz, and the concentration of 100 mg ml −1 for the RMM/900 °C samples with various Sr contents, are presented in figure 4. Figures 5 and 6 show the heating curves of the Sr.25/900 °C in the field with a frequency of 236 kHz at various concentrations of NPs and the fixed field amplitude of 80 Oe, and at various field strengths and the fixed NP concentration of 100 mg ml −1, respectively. The MIH measurements for the Sr.15/SMM/700 °C samples were performed in the field of frequency of 219 kHz for various field amplitudes and the temperature increase curves are depicted in figure 7. The observed heating curves distinctly demonstrate that after a time of less than about 10 min, the heating temperature of the samples tends to saturate at some characteristic temperature T s . As indicated by example data gathered in table 2, the saturation temperature is a few degrees below the corresponding Curie temperature. This result means that the manganite NPs can be used as a good self-fusing heating mediator for hyperthermia.
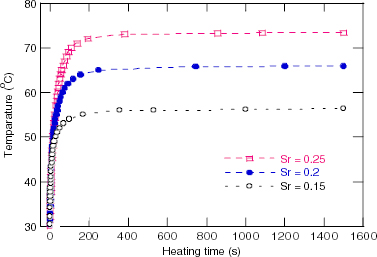
Figure 4 Heating curves for various Sr content samples annealed at 900 °C measured at 100 mg ml −1 in a field of 236 kHz/80 Oe.
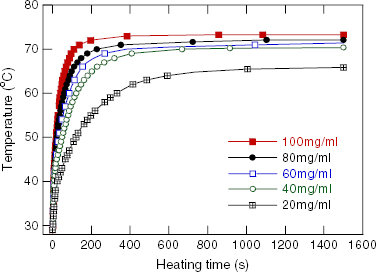
Figure 5 Heating curves for a Sr.25/RMM/900 °C sample in a field of 236 kHz/80 Oe with various concentrations.
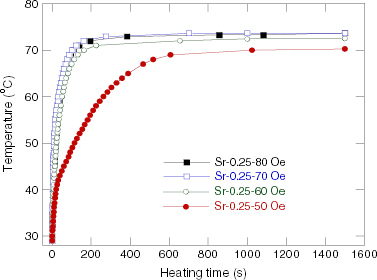
Figure 6 Heating curves for Sr.25/RMM/900 °C samples of 100 mg ml −1 concentration in a field of 236 kHz and various amplitudes.
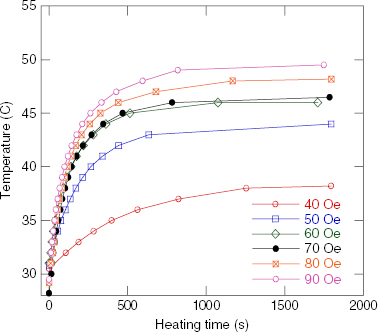
Figure 7 Heating curves for a Sr.15/SMM/700 °C sample of 100 mg ml −1 concentration in a field of 219 kHz and various amplitudes.
Figure 8 presents the dependence of saturation temperature on NP concentration for two MIH series data, namely a 100 mg ml −1 concentration in a field of 219 kHz and 80 Oe for Sr.15/SMM/900 °C and a 100 mg ml −1 concentration in a field of 236 kHz and 80 Oe for Sr.25/RMM/900 °C. As one can see, the relation between the two quantities is nonlinear, like the case of that observed for Fe 3 O 4 NPs [7, 8], and more important is that such a behavior depends neither on the way in which the NPs are prepared nor on the field frequency.
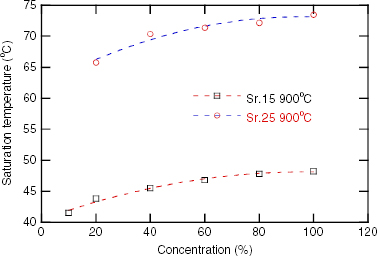
Figure 8 Saturation temperature versus concentration for Sr.15/SMM/900 ° and Sr.25/RMM/900 ° samples measured at 80 Oe and frequencies, respectively, of 219 kHz and 236 kHz.
From the curves in figure 7 we calculated the initial rate of initial temperature increase d
T/d
t for various measuring field strengths in the range of 40–80 Oe and plotted the slope against field as presented on figure 9. As is clearly shown, the field dependence of the specific loss power (SLP) does not follow the H2-law (formula (
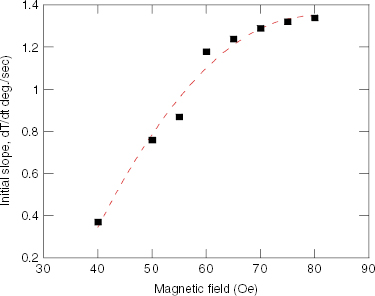
Figure 9 Initial slope of temperature increase versus field strength for a 100 mg ml −1 Sr.15/RMM/700 °C sample in a field of 80 Oe and 219 kHz.
Last but not the least important characteristic of the MIH investigations we want to note is that we observed some sudden change in temperature increase versus time curves for several MIH experiments of the manganite NPs. In addition to some indications shown in figures 4–7, figure 10 demonstrates more evidence for the experiment of 20 mg ml −1 of Sr.20/900 °C NPs in a field of 236 kHz and 80 Oe. The time dependence of the heating rate d T/d t shows convincingly a two region behavior of the later quantity for which the turn point appears at 32 seconds, which corresponds to the temperature of 37 °C. While supposing this temperature to be related to the onset temperature of material magnetization, we name it as T b,heat . More detailed research is under way to prove this assumption.
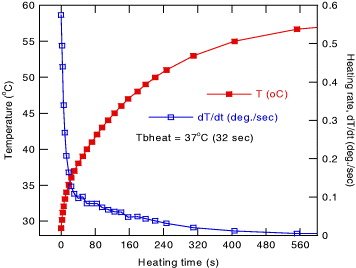
Figure 10 Heating temperature and heating rate versus time for a Sr.20/RMM sample annealed at 900° measured at 20 mg ml −1 in a field of 236 kHz, 80 Oe.
Finally, we present in figure 11 heating curves measured in a field of 236 kHz, 60 and 80 Oe at a concentration of 20 mg ml −1 of Sr.25/RMM/900° NPs in water and in oil. By comparison of the corresponding curves, one can see that the saturation temperature of the oil ferrofluid is about 4 ° higher and its specific loss power is two times greater than the corresponding parameters of the water ferrofluid. The observed better heating performance of the oil ferrofluid is assumed to result from its higher viscosity.
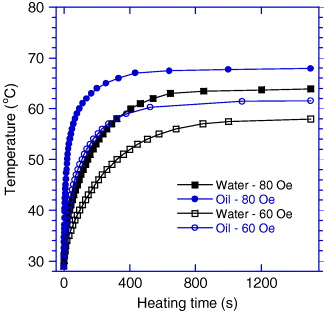
Figure 11 Heating curves for Sr.25/RMM/900 °C at a concentration of 20 mg ml −1 in oil (O) and water (W) measured in a field of 236 kHz with two amplitudes of 60 and 80 Oe.
4. Conclusion
By careful and systematic measurements of heating curves for ferrofluids of La 0.7 Sr x Ca 0.3−x NPs, several specific characteristics of heating effects have been indicated:
- Saturation heating temperature, which could be explained by T C -related fuse of heating.
- Two regions of temperature increase rate have been shown for which the heating characteristic temperature T b,heat is preliminarily assumed to relate to the magnetization onset temperature of the blocking type, T b,mag .
- Heating power versus heating field amplitude does not follow the square law for the case of high NP concentration. This suggests the existence of some strong dipolar interaction between the nanoparticles in dense ferrofluids.
Remarks (ii) and (iii) require more investigations to elucidate the relationship between heating characteristics and basic properties of the magnetic nanoparticle system.
Acknowledgments
The research has been done with financial support from a grant of the National Foundation for Science and Technology Development (Code: 103.02.48.09).