
Abstract
Nd10.5Fe83.5−xGaxB6 (x=1.5, 3 and 4.5) ribbons were prepared by melt-spinning method with various wheel speeds from 5 to 40 m s−1. Strong crystallographic texture with c-axis of Nd2Fe14B crystallites along normal of the ribbon surface was observed. The texture degree can be enhanced by decreasing the quenching rate during solidification of the melt and by increasing the concentration of Ga. Preferred orientation of the nanocrystallites with their size of 10–30 nm is obtained not only by controlling the quenching rate of the melt during solidification but also by appropriately annealing the over-quenched ribbons. The texture of microstructure clearly affects magnetic anisotropy of the ribbons. With increasing concentration of Ga, the magnetic anisotropy of the ribbons is considerably increased. The coercivity above 6.5 kOe and maximum energy products larger than 15 MGOe can be achieved on the ribbons with Ga-concentration of 1.5%.
Export citation and abstract BibTeX RIS

Content from this work may be used under the terms of the Creative Commons Attribution-NonCommercial-ShareAlike 3.0 licence. Any further distribution of this work must maintain attribution to the author(s) and the title of the work, journal citation and DOI.
1. Introduction
Nd–Fe–B-based rapidly solidified alloys have been extensively studied due to their application potential as hard magnetic nanocomposites or exchange spring magnets. These hard magnetic materials consist of nanocrystalline phases of Nd 2 Fe 14 B, Fe 3 B and α-Fe [1], which are magnetically coupled via exchange interaction resulting in a possibility to produce permanent magnets with high maximum energy product (BH) max [2]. In fact, experimental achievement of the exchange spring magnets is far from theoretical prediction, above 1000 kJ m −3. The most difficult issue in the experiment to push the maximum energy product up to the theoretical limit is how to induce magnetic anisotropy in these materials. If the easy axis of the nanocrystalline grains is aligned, the maximum energy product of these hard magnetic materials can approach theoretical limit. So far, a lot of effort of scientists has been devoted to overcoming this challenge. Hot deformation [3–5] and spark plasma sintering [6,7] are efficient methods to manufacture bulk-anisotropic nanocomposite magnets possessing high density and high maximum energy product. Nevertheless, these methods are restricted by their rather complicated technological process. By quenching [8] or annealing in magnetic field [9,10], anisotropy of the melt-spun ribbons could be induced. However, magnitude of the induced anisotropy obtained by these ways is relatively small. Some publications [11–13] showed that addition of elements such us Ga, Cu, Zr ... can also affect anisotropy of the exchange spring magnets. It should be noted that Ga could considerably influence the preferred orientation or texture of the crystalline grains in a number of the alloys prepared by rapid solidification [12–19].
In this work, we investigated the influence of Ga on texture and magnetic properties of Nd–Fe–Ga–B alloys prepared by melt-spinning method.
2. Experimental
Ingots with nominal compositions of Nd 10.5 Fe 83.5−x Ga x B 6 (x=1.5, 3 and 4.5) were prepared from pure components of Nd, Fe, Ga and FeB on an arc-melting furnace to ensure their homogeneity. The ribbons were then fabricated on a single wheel melt-spinning system. The quenching rate of the ribbons could be changed by changing tangential velocity, v, of the wheel. In this study, the ribbons with thickness of about 20, 30, 60 and 150 μm were obtained by melt-spinning with different values of v of 40, 30, 10 and 5 ms −1, respectively. Some of the ribbons were annealed at 700 °C for 10 min to investigate influence of annealing process on nanocrystallization of the material. All the arc-melting, melt-spinning and annealing processes were performed under Ar atmosphere to avoid oxygenation. Structure of the ribbons was analyzed by x-ray diffraction (XRD) and electron microscopy methods. Magnetic properties of the alloys were investigated by hysteresis measurement on a pulsed field magnetometer.
3. Results and discussion
X-ray diffraction patterns performed on the surface of the free side (free side-XRD) of the as-quenched Nd 10.5 Fe 83.5–x Ga x B 6 (x=1.5, 3 and 4.5) ribbons with various velocities (v=30, 10 and 5 m s −1) of the copper wheel reveal that all of them more or less reflect the preferred orientation in crystallization.
Figure 1 presents representative free side-XRD patterns of the ribbons with x=3. We can see that most of the diffraction peaks on the patterns correspond to Nd 2 Fe 14 B and α-Fe phases and the sharpness or intensity of the peaks greatly increases with decreasing velocity of the wheel from 30 to 5 m s −1. Strong reflections of (002), (004) and (008) peaks of the Nd 2 Fe 14 B phase are clearly observed. This means the c-axis of the Nd 2 Fe 14 B crystallites is directionally preferred to normal of plane of the ribbons. The preferred orientation of α-Fe phase was also observed. However, the texture of the soft magnetic phase is not important for enhancing the maximum energy product of the exchange spring magnets. Therefore, the texture of the α-Fe phase was not analyzed in the scope of this paper. Degree of the c-axis texture of Nd 2 Fe 14 B phase can be estimated by comparing relative intensity of the (00 l) peaks, referred to as I(00L), to that of (410) peak, referred to as I(410), which has the strongest intensity in the standard powder-XRD patterns of Nd 2 Fe 14 B phase. Table 1 is a list of the I(00L)/I(410) ratios of the prepared ribbons with various values of x and v. It should be noted that the I(00L)/I(410) ratio is generally raised by lowering the wheel speed. Thus, degree of the texture in the ribbons is enhanced by decreasing the quenching rate of the melts.
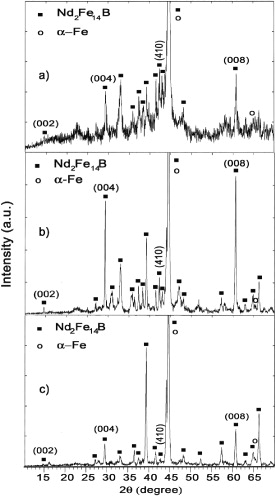
Figure 1 Free side-XRD patterns of Nd 10.5 Fe 80.5 Ga 3 B 6 (x=3) ribbons with various wheel speeds of 30 (a), 10 (b) and 5 m s −1 (c).
Table 1. I(00L)/I(410) ratios of Nd 10.5 Fe 83.5−x Ga x B 6 ribbons with various Ga concentrations (x) and wheel speeds (v).
| 1.5 | I(002)/I(410) | 0.01 | 0.109 | 0.218 | 0.280 | 0.195 |
| I(004)/I(410) | 0.09 | 0.463 | 1.200 | 2.218 | 1.271 | |
| I(008)/I(410) | 0.07 | 0.431 | 1.840 | 1.937 | 1.750 | |
| 3.0 | I(002)/I(410) | 0.01 | 0.202 | 0.218 | 0.363 | 0.842 |
| I(004)/I(410) | 0.09 | 0.729 | 2.937 | 3.045 | 2.789 | |
| I(008)/I(410) | 0.07 | 0.893 | 3.562 | 5.045 | 5.052 | |
| 4.5 | I(002)/I(410) | 0.01 | 0.246 | 0.727 | 0.263 | 0.167 |
| I(004)/I(410) | 0.09 | 0.415 | 1.509 | 4.736 | 1.687 | |
| I(008)/I(410) | 0.07 | 0.446 | 1.636 | 10.00 | 2.145 |
Influence of Ga concentration on the microstructure of the ribbons is observed. With the same wheel speed of 30 m s −1, the amorphous phase in the ribbons is larger when Ga concentration is increased (figure 2). Thus, Ga can improve glass forming ability (GFA) of the Nd–Fe–B alloys with appropriate concentrations. Besides that, the texture degree of the ribbons is also influenced by Ga concentration. For instance, the I(004)/I(410) and I(008)/I(410) ratios of 0.73 and 0.89 of the ribbons with x=3, are quite larger than those of 0.46 and 0.43 of the ribbons with x=1.5, respectively. We can see the dependence of the I(00L)/I(410) ratios on Ga concentration of the ribbons in table 1. In general, the crystallographic texture of the ribbons is stronger with higher concentration of Ga.
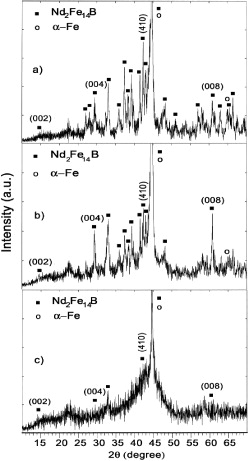
Figure 2 Free side-XRD patterns of Nd 10.5 Fe 83.5−x Ga x B 6 ribbons with the same wheel speed of 30 m s −1 but with various Ga concentrations of 1.5 (a), 3 (b) and 4.5 (c).
Figure 3 shows the free side-, wheel side- and powder-XRD patterns of the ribbons with x=4.5 and v=5 m s −1. We can see the highly texture reflections on both sides of the ribbons. This means that the Nd 2 Fe 14 B grains are directionally crystallized throughout the thickness of the ribbons. As for the powder sample, reflection of the texture disappears due to random orientation of the crystallites. The degree of texture between the two sides of the ribbons, however, is different. As shown in table 1, the I(00L)/I(410) ratios of the free side are larger than those of the wheel side. This can be explained by the quenching rate at the free side being lower than that at the wheel side leading to stronger texture at the free side.
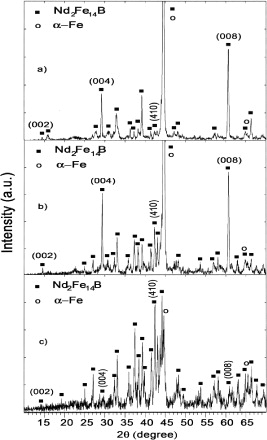
Figure 3 Free side- (a), wheel side- (b) and powder- (c) XRD patterns of Nd 10.5 Fe 89 Ga 4.5 B 6 (x=4.5) ribbons with wheel speed of 5 m s −1.
To investigate the crystallographic texture inside the ribbons, their cross sections were observed by a high-resolution scanning electron microscope (SEM). Figure 4 shows SEM images taken from cross sections of the ribbons with different values of x (1.5, 3 and 4.5) and v (5 and 10 m s −1). We can see the streaks or columns along the normal direction (the arrows in the images) of the ribbon plane indicating the preferred orientation of the crystalline particles. The texture degree obviously depends on the Ga concentration and the strongest texture is observed on the ribbons with x=4.5. The crystalline particles in stick-like shape with their long axis oriented to the normal of the ribbon plane appear in the images. The size of these grains (up to ∼100 nm) is dependent on both the quenching rate and Ga concentration. As for the ribbons with v=30 m s −1, the crystalline grains could not be observed in the as-quenched state. However, the nanoparticles with the size of 20–30 nm are clearly observed in these ribbons after annealing at 700 °C for 10 min (figure 5). It should be noted that the nanoparticles are directionally crystallized to a quite strong degree. Similarly, the ribbons with v=40 m s −1 also reveal crystallographic texture after annealing. Before annealing, these ribbons are fully amorphous (see figure 6(a)). However, high resolution transmission electron microscopy (HR-TEM) images show streaks or columns of the atoms along the normal of the ribbons (figure 6(b)). The stick-like grains with their length of 10–20 nm are observed in the annealed ribbons (figure 6(c)). The texture of the annealed ribbons is reconfirmed by selected area electron diffraction (SAED) technique. The bright-dots in the SAED pattern (figure 6(d)), which is due to electron diffraction, are not distributed homogeneously but concentrated at certain areas indicating the preferred crystallization of the grains. The crystallographic texture in the Nd–Fe–Ga–B ribbons might be due to the effect of Ga addition. In our previous studies [21,22], the preferred orientation of crystallization of crystallites were not observed with the ribbons prepared with similar conditions but with addition of Nb and Co. The effect of Ga on the texture was also found in other alloys such as Fe–Ga–Al–C, Fe–Ni–Ga, Fe–Co–Ga, Ni–Mn–Ga ... fabricated by rapid solidification method [15–19]. It is suggested that the low melting temperature of Ga is a reason for inducing crystallographic texture for the Ga-containing melt-spun ribbons.
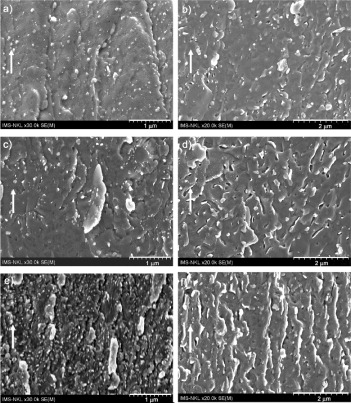
Figure 4 SEM images taken from cross sections of Nd 10.5 Fe 83.5−x Ga x B 6 ribbons with various Ga concentrations (x) and wheel speeds (v): (a) x=1.5 at%, v=10 m s −1; (b) x=1.5 at%, v=5 m s −1; (c) x=3 at%, v=10 m s −1; (d) x=3 at%, v=5 m s −1; (e) x=4.5 at%, v=10 m s −1; (f) x=4.5 at%, v=5 m s −1.
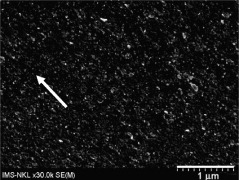
Figure 5 SEM image taken from cross sections of Nd 10.5 Fe 80.5 Ga 3 B 6 (x=3) ribbons, with wheel speed of 30 m s −1, annealed at 700 °C for 10 min.
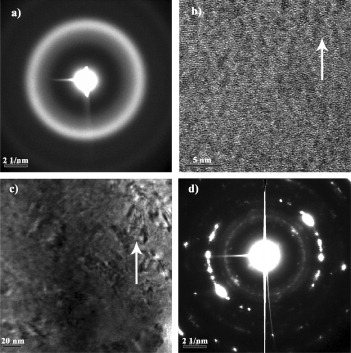
Figure 6 SAED pattern (a) and HR-TEM image (b) of the as-quenched Nd 10.5 Fe 80.5 Ga 3 B 6 (x=3) ribbons with wheel speed of 40 m s −1; TEM image (c) and SAED pattern (d) of these ribbons after annealing at 700 °C for 10 min.
Magnetic properties of the Nd 10.5 Fe 83.5−x Ga x B 6 (x=1.5, 3 and 4.5) melt-spun ribbons were investigated by hysteresis measurements. The results manifest that the coercivity of the ribbons with v=5 and 30 m s −1 is rather small, μ0 H c < 0.15 T, while the ribbons with v=10 m s −1 have μ0 H c above 0.2 T. This can be explained by the size of the crystallites formed during solidification of the ribbons. With v=5 m s −1, the quenching rate is low so that the crystalline grain size exceeds the optimal value resulting in small coercivities of the ribbons [2]. As for the ribbons with v=30 m s −1, the quenching rate is too high and the crystallites in the ribbons are much smaller than the optimal size leading to bad coercive forces. To achieve larger coercivities, a control for the wheel speed should be applied to find out the optimal quenching rate of the ribbons. An annealing process for the over-quenched ribbons can also be used to form the nanocrystalline particles with the optimal size.
The effect of the crystallographic texture on magnetic anisotropy of the ribbons was investigated by applying the external magnetic field parallel (H par ) and perpendicular (H per ) to the normal of the ribbon surface during the hysteresis measuring process. Figure 7 shows hysteresis loops of the ribbons with v=10 m s −1 measured in different directions of the applied field. We can realize that although the coercivities are nearly the same with H par and H per , the M(H par ) curves are quite different from M(H per ) ones. Note that the demagnetizing effect was corrected. For all the ribbons with various concentrations of Ga, the squareness of the M(H par ) loop is better than that of the M(H per ) one. On the other hand, the M r par /M r per ratio (where M r par and M r per are remanent magnetizations determined from M(H par ) and M(H per ), respectively) is also dependent on the Ga concentration. The higher M r par /M r per ratio implies the higher magnetic anisotropy of the ribbons. The influence of Ga on the coercivity, remanent magnetization and M r par /M r per ratio of the ribbons with v=10 m s −1 is shown in table 2. We can see that the coercivity (μ o H c ) and remanent magnetization (M r par ) of the ribbons slightly decrease with increasing concentration of Ga. On the contrary, the M r par /M r per ratio of the ribbons is increased considerably with increasing concentration of Ga. Thus, the texture of microstructure caused by Ga addition quite strongly affects magnetic anisotropic property of the ribbons.
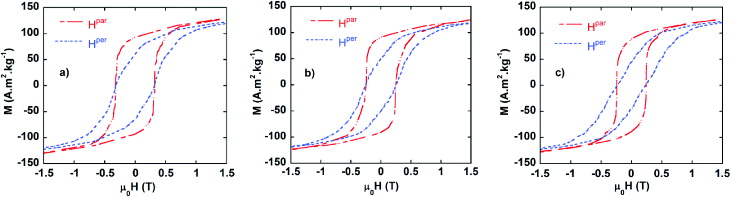
Figure 7 M(H par ) and M(H per ) curves of Nd 10.5 Fe 83.5−x Ga x B 6 ribbons with the same wheel speed of 10 m s −1 but with various Ga concentrations of 1.5 (a), 3 (b) and 4.5 (c).
Table 2. Influence of Ga on coercivity, remanent magnetization and M r par /M r per ratio of the ribbons with v=10 m s −1.
| 1.5 | 0.32 | 93 | 60 | 1.55 |
| 3.0 | 0.27 | 91 | 50 | 1.82 |
| 4.5 | 0.24 | 88 | 44 | 2.0 |
In order to investigate the influence of annealing conditions on magnetic properties of these materials, the ribbons with x=1.5 and v=30 m s −1 were selected to anneal. The annealing temperature, T a , was varied from 625 to 750 °C (this is a crystalline temperature region of Nd 2 Fe 14 B hard magnetic phase) and the annealing time, t a , was selected for 10 min. Figure 8 presents representative hysteresis loops of the as-quenched and annealed Nd 10.5 Fe 82 Ga 1.5 B 6 ribbons with v=30 m s −1. The obtained results showed that the annealing temperature clearly influences the magnetic properties of the alloys. The hysteresis loop of all the samples greatly expands after annealing. In comparison with as-quenched ribbons, the hysteresis squareness of the annealed ones is considerably improved. That means the hard magnetic phase was formed in the annealed alloys resulting in the increase of coercivity of the material.
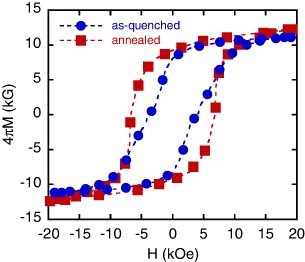
Figure 8 Hysteresis loops of Nd 10.5 Fe 82 Ga 1.5 B 6 ribbons before (as-quenched) and after annealing at 700 °C for 10 min.
From the hysteresis loops, coercivities and maximum energy products of the samples were determined. Figure 9 shows dependence of coercivity, H c , and maximum energy product, (BH) max , on annealing temperature, T a , of the Nd 10.5 Fe 82 Ga 1.5 B 6 ribbons. The obtained results show that the optimal annealing temperature for the alloy is about 700 °C. The coercivity higher than 6.5 kOe and maximum energy products larger than 15 MGOe of the alloy were achieved at the optimal annealing temperature.
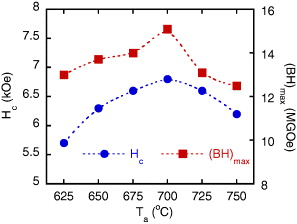
Figure 9 Dependence of coercivity, H c , and maximum energy product, (BH) max , on annealing temperature (T a ) of the Nd 10.5 Fe 82 Ga 1.5 B 6 ribbons.
4. Conclusion
Strong crystallographic texture with c-axis of the Nd 2 Fe 14 B crystallites along normal of the surface was observed in Nd 10.5 Fe 83.5−x Ga x B 6 (x=1.5, 3 and 4.5) ribbons prepared by melt-spinning method. The texture is increased by decreasing the quenching rate during solidification of the melt or by increasing the concentration of Ga. Preferred directional crystallization of the nanocrystalline grains can be obtained not only by controlling the quenching rate of the melt during solidification but also by appropriately annealing the over-quenched ribbons. The texture of microstructure clearly affects magnetic anisotropy of the ribbons. This is a significant result for producing anisotropic exchange spring magnets. By means of appropriate thermal treatment, the coercivity above 6.5 kOe and maximum energy products larger than 15 MGOe can be achieved on the ribbons with Ga-concentration of 1.5%.
Acknowledgments
This work was supported by National Foundation for Science and Technology Development (NAFOSTED) of Vietnam under grant No 103.02.40.09. A part of our work was done in the Key Laboratory of Electronic Materials and Devices, Institute of Materials Science. TEM analyses were performed at Institute of Physics, Chemnitz University of Technology, Germany.