
Abstract
Water soluble CdSe/CdS quantum dots (QDs) have been synthesized directly in aqueous solution with sodium citrate as surfactant agent. The QDs are mono-dispersed in water and have strong luminescent emission intensity under excitation of ultraviolet light. The emission maxima of the QDs can be tuned in a wider range from 555 to 615 nm in water by changing synthesis conditions. The result of the synthesis of water-soluble CdSe and CdSe/CdS QDs shows the high quality of the QDs with the quite narrow luminescence emission band and photostability. The results show the strongest intensity of photoluminescence emission in media with pH value at about from 8–8.5, which are pH physiological environments. The luminescence intensity increases when the QDs are coated with a polyethylene glycol (PEG) or bovine serum albumin (BSA) protein layer, the lifetime also increases.
Export citation and abstract BibTeX RIS

Content from this work may be used under the terms of the Creative Commons Attribution-NonCommercial-ShareAlike 3.0 licence. Any further distribution of this work must maintain attribution to the author(s) and the title of the work, journal citation and DOI.
1. Introduction
Quantum dots (QDs) (semiconductor nanocrystals) have now great potential for use as diagnostic and imaging agents in biomedicine and as semiconductors in the electronics industry [1, 2], since they have strong photoluminescence and tunable optical capabilities. CdSe and CdTe quantum dots are used widely because, due to the quantum effect of the electron confinement, their emission wavelengths span the entire visible light spectrum [3, 4]. Preparation of QDs with the aim of biological applications is of widespread interest throughout the world.
In order to be used in biological imaging applications, QDs need to be water soluble because almost all biological environments are water. Water soluble QDs can be used directly as labeling and imaging for biological applications. QDs can be synthesized via different ways. The traditional approach to preparing QDs is using toxic semiconductor precursors at high temperature in organic solvent such as trioctylphosphine oxide (TOPO) and hexadecylamine (HDA), and they have to be made water soluble by replacing the hydrophobic TOPO layer with bifunctional molecules containing thiol and hydrophilic moieties separated by a molecular spacer or adding a silica shell to the nanoparticles by using alkoxysilanes during the polycondensation [3]. The QDs normally have been protected by a molecular layer of stabile agents such as phosphonic acids, polyacrylic acid, penicillamine layers [5–7], etc, that make QDs useable in photonics and biochemistry applications.
Beside many methods of preparing colloidal QDs using toxic precursors, one simple route known for fabricating water soluble CdSe and CdSe/CdS QDs is synthesis directly in aqueous solution with sodium citrate used as surfactant agent [8]. This is a green method with non-toxic chemicals which gives a number of good quality water soluble CdSe and CdSe/CdS QDs.
In this work, we prepared water soluble CdSe and CdSe/CdS core/shell QDs under different conditions of synthesis. The emission maxima of the QDs can be tuned in a wider range from 555 to 615 nm in water by changing synthesis conditions. The result of the synthesis of water soluble CdSe and CdSe/CdS QDs shows the high quality of the QDs with the quite narrow luminescence emission band and photostability. For the aim of biological applications, the photoluminescence spectra in environments with different pH values are also measured. The luminescence intensity is increased when the QDs are coated with a polyethylene glycol (PEG) or bovine serum albumin (BSA) protein layer, the lifetime is also increased. The prepared CdSe/CdS QDs are stable with high photoluminescence intensity for many months.
2. Experimental
CdSe and CdSe/CdS QDs were synthesized using bidistilled water and the following chemicals: selenium powder (Se), sodium borohydride (NaBH 4, 99%), absolute ethanol, Na 2 S·9H 2 O (98%), CdCl 2·2.5H 2 O (99%), trisodium citrate dihydrate (99%), tris (hydroxymethyl) aminomethane (Tris) (99%), hydrochloric acid, sulfuric acid, and sodium hydroxide (96%). Firstly, in absolute ethanol under the condition of magnetic stirring and N2 atmosphere, Se powder reacted with sodium borohydride to form NaHSe solution. The time of this synthesis step took 30 min. On the other side, trisodium citrate dihydrate was added into tris–HCl buffer solution with an initial pH value in a three neck bottle, then cadmium chloride solution (0.1 mmol) were added dropwise with magnetic stirring, forming the solution containing ions Cd 2+ protected by citrate molecules. The total volume of original solution was 50 ml. The initial molar ratio Cd/Se/citrate was taken to have different values 4:1:10, 4:1:20 and 4:1:30. Secondly, H 2 Se gas was created by the reaction of above NaHSe solution with diluted H 2 SO 4. The reaction is passed through the oxygen-free original solution at an appointed synthesis temperature in water-bath together with a slow nitrogen flow. The H 2 Se gas reacted with the above ion Cd 2+ solution forming CdSe QDs under vigorously stirring condition.
CdSe/CdS QDs solutions were synthesized by blowing H 2 S gas generated from the reaction of Na 2 S solution with diluted H 2 SO 4 into the CdSe core solutions synthesized as described above with slow nitrogen.
The size of the CdSe/CdS QDs was estimated by transmission electron microscopy (TEM) (JEOL JEM 1011, Japan). Optical absorption spectra (UV–Vis) of CdSe/CdS QD samples were performed in the wavelength region 300–750 nm (Jasco V-600, Japan). A monochromatized 450 W Xe light source (200 nm<λ exc < 900 nm) (FS920 Edinburgh, England) was used for measuring photoluminescence (PL) spectra and photoluminescence excitation (PLE) spectra at room temperature.
3. Results and discussion
3.1. The prepared CdSe/CdS QDs
The prepared CdSe/CdS QD samples are a transparent aqueous solution under visible light with brown color, which is the color of cadmium selenide semiconductor. They have strong luminescent emission intensity under excitation of ultraviolet light with the color emission dependent on the size of CdSe particles (figure 1). The TEM images show that the QDs are quite mono-dispersed in water (see figure 2). The size of the CdSe cores is estimated as 3–6 nm and the size of CdSe/CdS QDs is estimated as 3.5–10 nm, depending on the citrate concentration. The mono-dispersion of the QDs is due to protection of surfactant agent citrate around nanoparticles. The result has demonstrated the ability for biolabeling applications of the QDs.
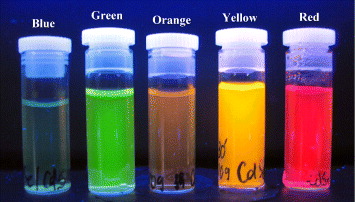
Figure 1 Photo image of CdSe/CdS QDs samples under ultraviolet light.
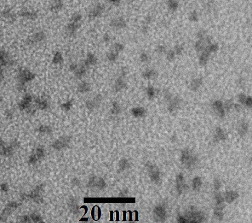
Figure 2 TEM image of CdSe/CdS QDs with emission peak at 605 nm.
The measurement of absorption spectra in UV–Vis region of the CdSe and CdSe/CdS nanocrystals was performed. The UV absorption spectra of one sample of the CdSe corresponding CdSe/CdS nanocrystals dispersed in aqueous solutions are shown in figure 3. There is a shift of the absorption edges toward lower wavelength compared with that of bulk CdSe crystal (λ bulk ∼ 690 nm corresponding to E g ≈ 1.8 eV at room temperature). This blue shift agreed with theory on the values of the effective bandgap of semiconductor nanocrystals (QDs). We can see that the absorption edges of CdSe and CdSe/CdS nanocrystals are the same. The size of the CdSe cores were estimated as 4 nm by the Efros, Brus and Kayanuma formula [9]. The size of other CdSe samples was estimated to be about 3–6 nm.
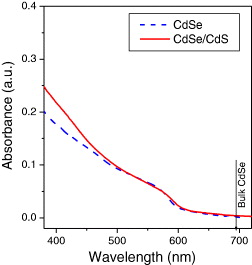
Figure 3 Absorption spectra of CdSe/CdS QDs compared with CdSe core with emission peak at 605 nm.
The PLE and PL spectra of CdSe and CdSe/CdS QDs are presented in figures 4 and 5, respectively. These CdSe and CdSe/CdS QDs were prepared in the same condition. The size of these CdSe cores was estimated by absorption spectra as about 5 nm. The quite narrow emission with full width at half maximum (FWHM) of ∼40 and 36 nm for CdSe and CdSe/CdS QDs, respectively and broad excitation bands of the QDs increasing toward the UV spectral region permit the use of variable and very large Stokes's shifts (>200 nm) [10]. The FWHM of CdSe/CdS QDs, which is smaller than that of CdSe cores, shows the role of CdS shell to make the CdSe cores' surface smoother and more stable. The CdS layer serves as a surface passivating layer and as a barrier assisting the electron–hole confinement in the CdSe core. The red shift (lower energies) of PL emission maximum of CdSe/CdS QDs (605 nm) in comparison with that of CdSe cores (580 nm) can be explained by the fact that there is a leakage of the exciton from the CdSe core into the CdS shell that has a more dramatic effect on the confinement energies of the charge carriers [9, 11].
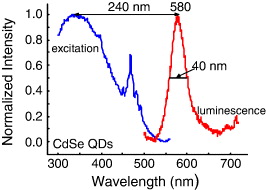
Figure 4 PLE and PL spectra of CdSe core QDs.
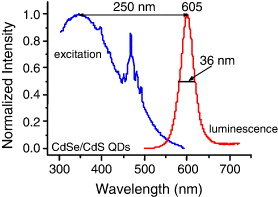
Figure 5 PLE and PL spectra of CdSe/CdS QDs.
The PL spectra of the QDs are quite narrow, the FWHM of PL spectra changes from 30 to 45 nm (figure 6). The quantum yields of the prepared QDs estimated via rhodamine 6G dye change from 20 to 40%.
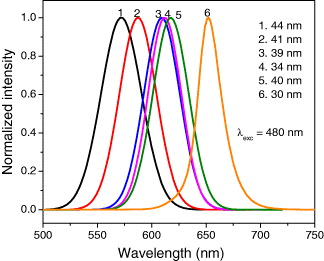
Figure 6 The FWHM of PL spectra of some CdSe/CdS QDs samples.
3.2. Optical characteristics under different conditions of synthesis
The CdSe core QDs have been prepared with different pH values of crude solution. We find that the appropriate pH value for the best synthesis of high-quality QDs is 8.9. Figure 7 presents the photoluminescence (PL) spectra of CdSe QDs with different pH values of initial solution. The pH of 8.9 gives the best emission of the QDs. We choose this pH value to prepare the CdSe/CdS QDs with different citrate concentration. The molar ratio (w) of the trisodiumcitrate dihydrate and the distilled water added for preparing tris–HCl is taken for the investigation to be 1, 1.5, 2, 2.5 and 3. Figure 8 shows the PL spectra of CdSe/CdS QDs with different w ratios, under excitation of 480 nm at room temperature. The PL maxima of the QDs are 612, 598, 584, 567 and 556 nm corresponding to the w ratios of 1, 1.5, 2, 2.5 and 3, respectively. We can see that when w ratio increases, the emission peak is shifted toward shorter wavelength. This result indicates that when the w ratio increases (corresponding to the citrate concentration increases), the size of the CdSe cores decreases so that the PL maxima shift toward shorter wavelengths due to the quantum size effect. The lowest PL intensity and the broadest FWHM of PL spectra of the QDs with the highest w ratio can be explained as due to the high citrate concentration. When the citrate concentration is higher, the equilibrium electrostatic state is lost more easily due to the COO- group outside QDs, so that the aggregation of the QDs can occur much more and makes the PL spectrum broader and unsymmetrical.
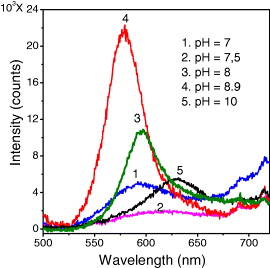
Figure 7 PL spectra of CdSe QDs with different pH values of initial solution.
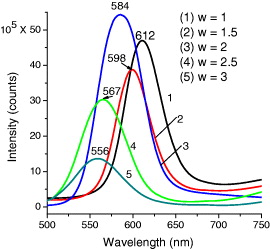
Figure 8 PL spectra of CdSe/CdS QDs with different w ratios.
The size of the CdSe QDs depended on the condition of synthesis. To investigate PL properties, we measured the PL spectra of CdSe QDs grown with different reaction times. Figure 9 presents the PL spectra of CdSe QDs grown with 0, 2, 4, and 21 h under excitation of 370 nm at room temperature. The maxima of PL emission bands are 571, 580, 590, 596 and 603 nm. This result implies that the size of the CdSe QDs increased with the time of preparation. As we know, due to quantum confinement effect, the size of nanocrystal quantum dots decreases (corresponding to the band gap increase), so that the emission maxima (corresponding to band-to-band transition) of QDs are shifted toward lower wavelength. The size of CdSe 0 h QDs is the smallest and the size of CdSe 21 h nanocrystal is the largest. The luminescence spectrum of CdSe 0 h sample is a broad band and the emission intensity is weak, but the luminescence spectrum of CdSe 21 h sample is a quite narrow band and has a nearly Gaussian shape. We can conclude that the longer the reaction time is, the more stable are the CdSe QDs, and the size of the CdSe QDs increases with the reaction time.
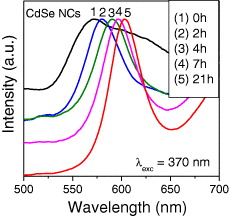
Figure 9 PL spectra of CdSe QDs with different growth times.
One interesting result of synthesizing CdSe/CdS core/shell QDs is that the PL emission maxima have red shift when the reaction time of CdS shell increases. Figure 10 presents the PL spectra of CdSe/CdS QDs with the same CdSe core but different reaction time of CdS shell under excitation of 480 nm. The CdSe/CdS QDs with 1, 23, 48, and 66 h CdS shell grown have PL peaks at 593, 596, 600 and 607 nm, respectively. This result indicates that CdS shell is thicker when the synthesis time increases, so that the probability of leakage of the exciton from CdSe core into CdS shell is higher [11]. The FWHM of these emission spectra is about 37, 39, 36 and 37 nm, respectively. For the longer synthesis time, the size of the QDs get stability, and no shift is observed in PL spectra.
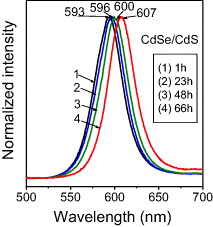
Figure 10 PL spectra of CdSe/CdS QDs with different growth times of CdS shell.
The PL spectra of CdSe/CdS core/shell QDs show the enhancement of emission intensity of CdSe QDs by CdS shell compared with that of CdSe nanocrystals unpassivated. The emission of the QDs also depends on the growth time of CdS shell. Figure 11 presents the PL spectra of CdSe/CdS QDs with different growth time of CdS shell for each w ratio under excitation of 480 nm, compared with PL spectra of CdSe cores. The relative emission intensity of CdSe/CdS QDs is up to ten times higher than the emission intensity of CdSe cores. One interesting result of synthesizing CdSe/CdS core/shell QDs is that: the PL emission maxima have red shift when the growth time of CdS shell is increased. This result indicates that CdS shell is thicker when the synthesis time increases, so that the probability of leakage of the exciton from CdSe core into CdS shell is higher [11], leading to the red shift of emission spectra.
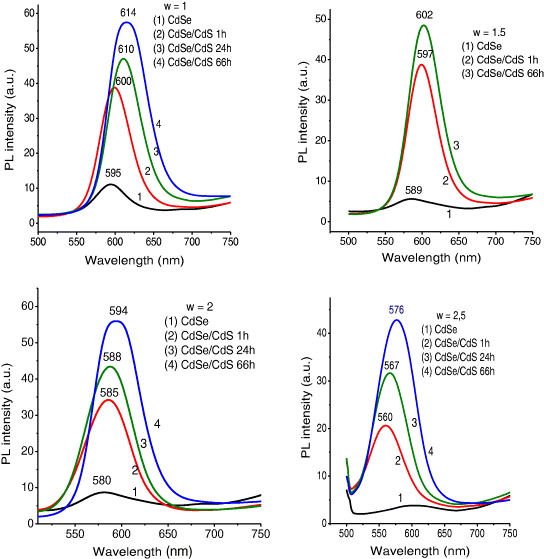
Figure 11 PL spectra of CdSe/CdS QDs with different growth times of CdS shell and different w ratios compared with those of CdSe cores.
3.3. The evolution of PL spectra with storing time
The prepared CdSe and CdSe/CdS QDs samples were kept in the condition of dark at room temperature. After preparation, the luminescence intensity of these QDs is strongly enhanced. Figure 12 presents the evolution of luminescence spectra of CdSe/CdS QDs with time under excitation wavelength of 480 nm at room temperature in the condition of the same absorbance. Freshly synthetic CdSe/CdS QDs show a weak luminescence. After being kept in the dark for a while, the emission intensity of the QDs increases remarkably. This result can be explained by the fact that citrate molecules play an important role in protecting the QDs against the aggregation, even making the QDs more stable and smoother, and excluding surface defects [8,12]. After about one year, the emission intensity of the QDs decreases but this decrease is small. This result shows a high photostability of the prepared QDs.
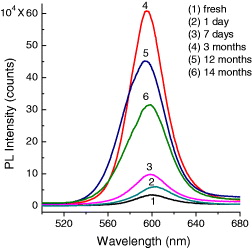
Figure 12 PL spectra of CdSe/CdS QDs (size ∼6 nm) as grown and after preparation.
3.4. Investigating the PL emission in a different pH environment and PEG and BSA coating
The CdSe/CdS QDs have been synthesized for bioapplications as a biological marker, so the spectral evolution must be taken into consideration when the pH value of the environment of QDs changes because biological objects have different pH environments. The measurement of spectral evolution of the QDs was carried out in environments with different pH values and the same concentration of QDs. Figure 13 presents evolution of photoluminescence spectra of CdSe/CdS QDs with the emission peak of original QDs of 610 nm in the condition of changing pH value of environment. The emission intensity is changed with varying pH values from 5 to 8.9, and the emission peak is also changed slightly with different pH values. The dependence of the PL intensity of the QDs on pH environment is shown in figure 14. The PL intensity is the highest with pH values of 8 and 8.5 (curves 5 and 6, figure 13) which are pH physiological environments. This indicates that the prepared CdSe/CdS QDs are suitable for bioapplications.
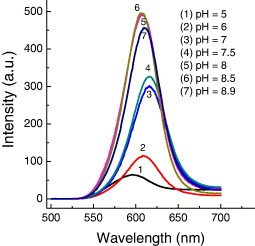
Figure 13 PL spectra of CdSe/CdS QDs (size ∼6 nm) with different pH values of environment.
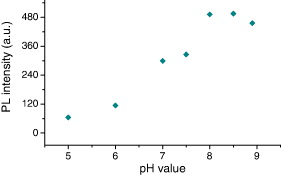
Figure 14 The pH dependence of PL intensity of CdSe/CdS QDs (size ∼6 nm).
In order to improve the emission of the CdSe/CdS QDs and bio-functionalize the QDs for bioapplications, we coated the prepared QDs by polyethylene glycol (PEG) or bovine serum albumin (BSA) protein layers. PEG or BSA was added into the CdSe/CdS solution with the molar ratio of PEG or BSA to the QDs being 2 : 1 under stirring at room temperature until optically clear. Figures 15 and 16 present the PL spectra of CdSe/CdS QDs after coating PEG and BSA layers, respectively, under excitation of 370 nm at room temperature. The PL intensity increases notably when coating PEG and BSA layers because the PEG and BSA layers make the QDs more stable and ignore the aggregation due to the polymer shells. Figure 17 shows the photoluminescence decay curves of CdSe/CdSe QDs and CdSe/CdS QDs coated by BSA and PEG layers with observed wavelength of 605 nm under excitation of 405 nm. We can see that the PL of CdSe/CdS QDs presents decay faster than the QDs with PEG and BSA shell layers. The result shows that the intrinsic radiative lifetime of the QDs increases with the PEG and BSA shells. This means that the quantum yield of the QDs increases when the QDs are coated by PEG and BSA layers. Moreover, the PEG and BSA shell layers can limit the toxicity from QDs when the QDs are used in biological environments.
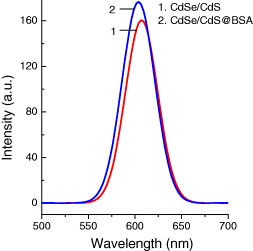
Figure 15 PL spectra of CdSe/CdS QDs coated BSA compared with that of uncoated CdSe/CdS QDs with the same absorbance at 370 nm.
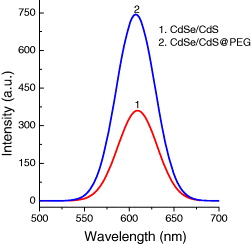
Figure 16 PL spectra of CdSe/CdS QDs coated PEG compared with that of uncoated CdSe/CdS QDs with the same absorbance at 370 nm.
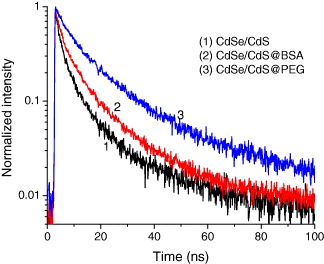
Figure 17 PL decay curves of CdSe/CdS QDs and CdSe/CdS QDs coated by BSA and PEG layers with wavelength analysis of 605 nm under excitation of 405 nm.
4. Conclusion
We have briefly presented the synthesis and photoluminescence properties of water soluble CdSe/CdS QDs prepared in our experiment. The QDs are mono-dispersed in water and have strong luminescent emission intensity under excitation of ultraviolet light. The emission maxima of the QDs can be tuned in a wider range from 555 to 615 nm in water by changing synthesis conditions. The result of the synthesis of water-soluble CdSe and CdSe/CdS QDs shows the high quality of the QDs with quite narrow luminescence emission band and photostability. The results show the strongest intensity of photoluminescence emission in media with pH value from about 8 to 8.5, which are pH physiological environments. The luminescence intensity is increased when the QDs are coated with a PEG or BSA protein layer, the lifetime is also increased. The colloidal CdSe/CdS QDs have high photostability which is almost unchanged after many months.
Acknowledgment
This work was supported in part by projects DH2011-04-07 of Thai Nguyen University.