
Abstract
The role of disclinations in the processing, microstructure and properties of bulk nanostructured materials is reviewed. Models of grain subdivision during severe plastic deformation (SPD) based on the disclination concept, a structural model of the bulk nanostructured materials processed by SPD are presented. The critical strength of triple junction disclinations is estimated. Kinetics of relaxation of triple junction disclinations and their role in the grain boundary diffusion are studied.
Export citation and abstract BibTeX RIS

Content from this work may be used under the terms of the Creative Commons Attribution 3.0 licence. Any further distribution of this work must maintain attribution to the author(s) and the title of the work, journal citation and DOI.
1. Introduction
Disclinations, along with dislocations, are well known linear defects of crystalline lattice [1–4]. The disclination concept is widely used in materials science to describe the structure and properties of grain boundaries, their triple junctions, the plastic deformation and fracture mechanisms, etc [3–8]. Disclinations play a particularly important role in the structure and properties of bulk nanostructured (NS) materials processed by severe plastic deformation (SPD) methods [9–12]. The present paper is a review on the origin of disclinations in bulk NS materials, their role in the structural modeling of these materials and in the grain boundary diffusion.
2. Definitions and basic relationships
Disclinations, along with dislocations, were first introduced in the mechanics of deformed solids by Volterra as specific linear sources of internal stresses [13]. These defects are created by making a cut in a cylindric body with a small inner hole along the axis and rotating the cut surfaces to a vector  with respect to each other simultaneously filling the arising gaps and eliminating excess material from overlaps. When the vector
  called Frank vector is parallel to the cylinder axis, the disclination is called a wedge one and if Frank vector is normal to cylinder axis, it is called a twist one. The magnitude of the Frank vector of a disclination, ω, is called the strength of the disclination.
Wedge disclinations, which are most easily visualized, are obtained by inserting or removing a wedge of material with an angle ω; respectively to these constructions, negative and positive wedge disclinations are considered (figures 1(a) and (b)). Below, only wedge disclinations will be considered.

Figure 1. Negative (a) and positive (b) wedge disclinations in a cylindric body; the cylinders are infinite along the direction normal to the paper plane. After inserting the wedge or closing the gap the material is allowed to relax.
Download figure:
Standard image High-resolution imageIn crystalline lattice, perfect and partial disclinations are distinguished; the Frank vectors  of these disclinations are, respectively, equivalent to a symmetry rotation and not compatible with any symmetry operation. A partial disclination necessarily bounds a grain boundary with a misorientation equal to the Frank vector of the disclination.
There is a close relationship between disclinations and dislocations. A terminated tilt boundary consisting of edge dislocations is modeled by a wedge disclination located at the termination line (figure 2(a)). Correspondingly, a finite tilt boundary is modeled by a dipole of wedge disclinations (figure 2(b)).

Figure 2. Equivalence between a disclination and terminated dislocation wall (a) and disclination dipole and finite wall (b); white triangles designate negative wedge disclinations and the black ones the positive disclinations.
Download figure:
Standard image High-resolution imageThe elastic energy of a wedge disclination located along the axis of a cylinder with radius R per unit length is equal to [2–4]

where G is shear modulus and ν the Poisson ratio.
As one can see from this equation, the elastic energy of disclinations diverges as the cylinder radius increases. Due to this, the existence of single disclinations is limited to very small crystals (thin films, nanoparticles, nanowires, etc). For example, they are quite common in pentagonal nanoparticles [14–16].
Screening of the stress fields greatly reduces the elastic energy of disclinations. The energy of the disclination dipole depicted in figure 2 is equal to [2–4]

that is, it diverges as the energy of a dislocation with the Burgers vector magnitude b = Lω .
Similarly, the energy of a disclination quadrupole consisting of two dipoles of opposite signs having the length L and separated by the same distance L will be similar to the energy of a dislocation dipole with the separation L:

Comparing equations (1) and (3) one can see that the energy of a disclination in a cylinder with radius R and in a quadrupole with size L = R are approximately equal. As will be seen below, disclinations accumulated in the grain junctions of polycrystals during plastic deformation are coupled into quadrupole configurations with the sizes approximately equal to the grain size. That is why the effects related to disclinations in a polycrystal with grain size d and in a cylinder with the same radius can be considered similar. This similarity arising from the similarity of screening distances is important for the further analysis.
3. Origin of disclinations in deformed polycrystals
Accumulation of dislocations in grain boundaries (GBs) and the formation of disclinations during plastic deformation of polycrystals have been explored by Rybin and co-authors [5,6,17,18]. Following their ideas, consider a GB that divides two grains s and s' and at the two ends is bounded by triple junctions A and B (figure 3(a)). Let N12 be the unit vector of the GB plane normal. Under the applied stress ms slip systems (np, bp)s (p = 1,2,..., ms) are activated in the sth grain (s = 1, 2) that leads to plastic strain of the grain, which is considered to be uniform. To maintain the integrity of material during deformation, the total strains of crystallites, which consist of elastic and plastic parts, must be equal to the total strain of a sample. However, different orientations of slip systems (np, bp)s in the grains with respect to the applied stress results in a difference of the plastic strain tensors  and
and  and plastic distortion tensors
  and
and  . Due to this difference, deformation leads to an accumulation of jumps of the plastic strain and distortion tensors across the GBs,
 ![$[\boldsymbol{\hat{\varepsilon}}]_{12}$](https://content.cld.iop.org/journals/2043-6262/4/3/033002/revision1/ansn473176ieqn8.gif) and
and ![$[\boldsymbol{\hat{\beta}}]_{12}$](https://content.cld.iop.org/journals/2043-6262/4/3/033002/revision1/ansn473176ieqn9.gif) , respectively. This incompatibility induces internal stresses, which, in combination with the applied stress, equalize the total strain rate in all grains and thus lead to an approximate fulfillment of Taylor's principle. The plastic incompatibilities accumulated on GBs can be described in terms of dislocations whose dimensionless surface density is given by the following tensor:
, respectively. This incompatibility induces internal stresses, which, in combination with the applied stress, equalize the total strain rate in all grains and thus lead to an approximate fulfillment of Taylor's principle. The plastic incompatibilities accumulated on GBs can be described in terms of dislocations whose dimensionless surface density is given by the following tensor:

This tensor is decomposed into two parts. The former part corresponds to the skew symmetric part of distortion jump, i.e. to the rotation tensor  . The second corresponds to the strain tensor
  that is equal to the symmetric part of the distortion jump:


The dislocations, which are described by the former expression, form compensated arrays causing an additional misorientation of adjoining grains; these arrays are stress-free. The dislocations described by the second equation form both compensated arrays of the first type and non-compensated dislocation arrays, which induce long-range internal stresses. The latter may be composed, for example, of dislocations with a Burgers vector tangential to the GB plane.
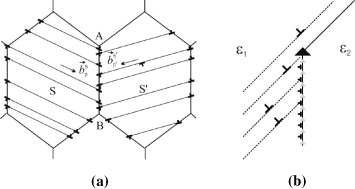
Figure 3. Accumulation of dislocations in grain boundaries due to slip in grains: (a) the general case and (b) a particular case when one grain is not deformed and one GB accumulates no dislocations. Dislocations forming the array modeled by junction disclination are represented in light gray color.
Download figure:
Standard image High-resolution imageThe additional misorientation of the grains 1 and 2 due to the dislocation accumulation in their GB can then be written as follows:

where [ ] is the vector of relative rotation of the crystallites.
If one now considers a triple junction, the misorientation mismatch, which is accumulated around this junction, is calculated by summing up equation (7) written for each of the three GBs. The first term gives nil sum, thus the total misorientation mismatch is equal to
Here the index i refers to ith GB. This equation shows that the incompatibilities of the plastic strains of differently oriented grains lead to the accumulation of disclinations in the junctions of grains.
The above analysis is clearly illustrated by a particular example of the junction of two grains, when one grain is not deformed ( ) and one GB is parallel to the slip plane of the first grain and does not accumulate dislocations during deformation (figure 3(b)). In this case only one facet of the GB contains an array of trapped dislocations that can be divided into the arrays of dislocations with tangential and normal Burgers vectors; the latter will be equivalent to a positive wedge disclination lying on the junction of the facets.
Rybin and co-workers [5,6,17,18] have shown that the above described process is a quite common feature of large plastic deformation and is an underlying process for the subdivision of the grains into fragments. They have shown that disclinations accumulated in junctions of grains induce internal stresses that activate an accommodation slip near the junctions to generate low-angle dislocation boundaries subdividing the grains into fragments. This process is described as the movement of disclinations across the grains. The process of fragmentation plays a key role in the processing of bulk NS materials by means of SPD methods.
4. Disclination modeling of grain subdivision during plastic deformation
In [19,20] two-dimensional (2D) disclination based models for the grain subdivision during SPD were proposed. The authors considered energetic criteria for the formation of new grain nuclea due to the accumulation of junction disclinations.
Consider a two-dimensional rectangular probe grain surrounded by other grains as shown in figure 4(a). Due to different orientations of the grain and its neighbor, arrays of dislocations are accumulated on the GBs. As shown above in section 3, these arrays can be divided into the planar mesodefects consisting of tangential dislocations and junction disclinations (figure 4(b)). The disclinations will have different strengths denoted ω, -qω, -gω, and kω, where 0 <q,g,k < 1 . That is, an asymmetric disclination quadrupole is formed in the junctions of the probe grain in general.

Figure 4. A rectangular 2D probe grain surrounded by neighbor grains in a deforming polycrystal (a) and mesoscopic defects formed in the GBs and junctions of the probe grain (b).
Download figure:
Standard image High-resolution imageWhen the disclinations accumulate a strength above some critical value, which, according to [6], is about 1°, low-angle dislocation boundaries start to grow from them. In [19] is was assumed that two diagonal boundaries with a misorientation angle ωx are formed as shown in figure 5(a) and the change of the elastic energy due to this was calculated. It was shown that at any value of ωx < ω the grain splitting is energetically favorable.

Figure 5. A model of grain subdivision due to disclinations: (a) the formation of diagonal low-angle boundaries and (b) four subgrains formed due to subdivision. Ellipses represent the grains in the corresponding description by the VPSC model.
Download figure:
Standard image High-resolution imageIn [21] this model was used to describe the evolution of the microstructure and texture of material during SPD on the basis of the well known viscoplastic self-consistent (VPSC) model [22]. In the latter, the grains of elliptic form deforming in a homogeneous effective medium representing the whole polycrystal are considered. The correspondence of these grains and the disclination model of splitting is clear from figures 5(a) and (b).
In another model [20] it is assumed that a disclination quadrupole with smaller arms 2l and 2d is formed at a boundary of a deforming grain (figure 6). This quadrupole serves as a nucleus of a misorientation band that can propagate through the grain and subdivide it as observed experimentally during plastic deformation [23–25]. It has been shown that such a nucleation is energetically favorable, and the energy gain depends on the symmetry parameter of the original quadrupole λ = 1 + g + q + k, the strength of nucleated quadrupole ωx and its arms 2l and 2d.

Figure 6. A model of misorientation band nucleation due to junction disclinations.
Download figure:
Standard image High-resolution image5. Limiting strength of junction disclinations
Disclinations induce stress fields diverging near their cores, that is, they are stress concentrators [2–4]. A negative wedge disclination induces tensile stresses near its core, which is why it is a preferential site for crack nucleation. The first model of crack formation at a triple junction disclination was proposed by Rybin and Zhukovskii [5]. For the grain size of 0.5 μm they predicted that a wedge disclination with a strength of 1.7° had an equilibrium crack length of about 0.07 μm. Essentially the same estimate was obtained by Gutkin and Ovid'ko for unsplit wedge disclinations [26]. These authors also predicted that the splitting of disclinations into ones with smaller strengths resulted in an amorphization of junctions and an increase of the equilibrium crack length.
In [27] the crack formation near a negative wedge disclination has been studied in detail by a combination of continuum mechanics and atomistic simulations. In the mechanical approach, the stress intensity factors and the opening displacement of a crack in a finite isotropic homogeneous cylinder containing a negative wedge disclination were calculated. The theory was exact in the sense that all boundary conditions were satisfied properly and the stress redistribution due to the crack growth was taken into account intrinsically in the governing equations. The theory predicted the existence of two equilibrium crack lengths at any value of the disclination strength. The shorter crack is unstable and has a length decreasing with an increase of the cylinder radius and disclination strength, while the longer one is stable and exhibits an opposite dependence on the radius and strength.
In the atomistic model a negative disclination was introduced along the axis of a bicrystalline Ni cylinder initially containing a special grain boundary Σ = 5 (310). The tilt axis of the GB and cylinder axis were parallel to the crystallographic direction [001]. The procedure of the construction of starting structures for simulations is illustrated in figure 7. In order to introduce a disclination with strength ω = θ1 - θ2 in a bicrystal with misorientation angle θ1 (figure 7(a)) two bicrystals with misorientation angles θ1 and θ2 were prepared (figure 7(b)) and joined applying necessary elastic rotations of the cut surfaces (figure 7(c)).
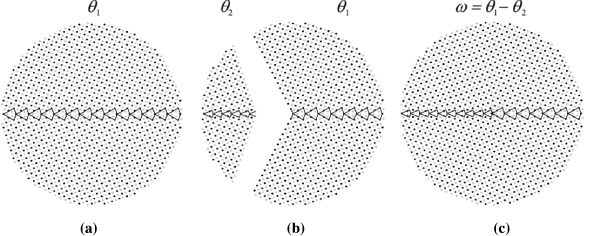
Figure 7. Schematic of constructing an initial configuration in the atomistic model. (a) f.c.c. bicrystal with [001] θ1 = 53.13° tilt GB; (b) f.c.c. bicrystals with [001] θ2 = 36.87° (left) and [001] θ1 = 53.13° (right) tilt GBs, respectively; (c) bicrystalline nanowire containing a ω = 16.26° wedge disclination along the central axis. Black and gray solid circles distinguish atoms lying on two successive (002) lattice planes.
Download figure:
Standard image High-resolution imageThe atomic systems so constructed were relaxed by molecular dynamics core XMD (http://xmd.sourceforge.net/) using embedded-atom potential for Ni [28]. The radius of the cylinder was equal to R = 25 nm.
The simulations have shown that above a critical disclination strength, which for this cylinder radius is equal to ωc ≈ 11.1°, a crack is nucleated near the core of the defect. Figure 8(a) presents a comparison of the dependences of stable crack length calculated in continuum mechanics (open circles) and atomistic models (crosses) for the same cylinder radius R = 25 nm. One can see that the agreement of the results is quite good; the difference becomes significant only when the crack length becomes comparable to the radius of cylinder that is caused by the effect of the surface. The dependence of the critical disclination strength ωc calculated in continuum mechanics is presented in figure 8(b). This dependence is interpolated with a good accuracy by the relationship

where R is substituted in nanometers and ωc is given in degrees. As one can see from this relationship, the critical strength of disclination slowly decreases with the increasing radius of the cylinder.
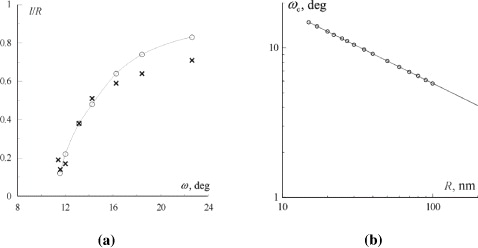
Figure 8. (a) Dependence of equilibrium crack length on disclination strength calculated for a cylinder with radius R = 25 nm by continuum mechanics approach (open circles) and atomistic simulations (crosses); (b) dependence of the critical strength of disclination on the cylinder radius.
Download figure:
Standard image High-resolution imageEquation (9) is useful in estimating the critical strength of disclinations in NS materials. As has been discussed after equation (3), the results obtained for a cylinder can be transferred to polycrystals assuming d ≈ R. Therefore, for polycrystals equation (9) will read  . Then, for example, ωc ≈ 5.6o for d = 100 nm and ωc = 3.9o for d = 200 nm. Similar results have been obtained in [29] also for triple junctions in Ni.
As has been suggested by Ovid'ko and co-worker [26], amorphization of the disclination core can be an additional channel of relaxation of the disclination stress fields. In this case, the formation of a crack would be retarded and the critical strength ωc would increase. The possibility of core amorphization has been explored for disclinations in [123] tilt boundaries in Ni and Pd [30] and ![$[1\bar 100]$](https://content.cld.iop.org/journals/2043-6262/4/3/033002/revision1/ansn473176ieqn15.gif) tilt boundaries in Ti [31]. It has been shown that in the f.c.c. metals the disclination core is stable against amorphization. In Ti at room and elevated temperatures disordering of the disclination core was shown to be common for the cylinder diameters larger than about 15 nm (figure 9). This disordering indeed results in an increase of the critical stress for crack nucleation as shown in the figure.
tilt boundaries in Ti [31]. It has been shown that in the f.c.c. metals the disclination core is stable against amorphization. In Ti at room and elevated temperatures disordering of the disclination core was shown to be common for the cylinder diameters larger than about 15 nm (figure 9). This disordering indeed results in an increase of the critical stress for crack nucleation as shown in the figure.
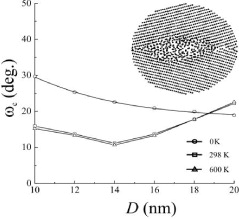
Figure 9. The D- and T-dependence of ωc for crack nucleation in a bicrystalline Ti nanowire containing a ![$[1\bar 100]$](https://content.cld.iop.org/journals/2043-6262/4/3/033002/revision1/ansn473176ieqn16.gif) tilt boundary. The atom configuration in the central region (8 nm diameter) of a 20 nm diameter nanowire is shown for T = 600 K and ω = 18.9° < ωc.
tilt boundary. The atom configuration in the central region (8 nm diameter) of a 20 nm diameter nanowire is shown for T = 600 K and ω = 18.9° < ωc.
Download figure:
Standard image High-resolution imageThus, the atomic simulations show that two main effects of the stress concentration near disclinations are possible: nucleation of nanosized cracks at supercritical strength and amorphization at subcritical strength, and the preference of these relaxation modes depends on material and, probably, on a character of the grain boundary in which the disclination is formed.
6. Disclinations in a structural modeling of nanostructured materials
At any time of plastic deformation in the grain junctions of a material there is a certain distribution of triple junction disclinations. When the deformation is stopped, these disclinations are inherited by the material and subsequently play an important role in its structure and properties. This fact has been put on the basis of a structural model of bulk NS materials processed by SPD [10–12].
In order to estimate the contribution of junction disclinations to the stresses and excess elastic energy in as-prepared NS materials a 2D model presented in figures 10(a) and (b) was considered. It is assumed that deformation in each grain ij brings a disclination quadrupole with the strength ωij into its junctions. The value of ωij depends on the strain of grain, has a zero mean value and some dispersion 〈 ω2 〉. The strengths of quadrupoles coming from different grains can be approximately considered as independent random quantities. At each junction there will be a junction disclination the strength of which is the sum of strengths of four neighbor disclination quadrupoles: Ω ij = ωij - ωi - 1,j + ωi - 1,j- 1 - ωi,j- 1. Correspondingly, the dispersion of the junction disclinations' strength will be equal to 〈Ω 2 〉 = 4〈ω2〉.
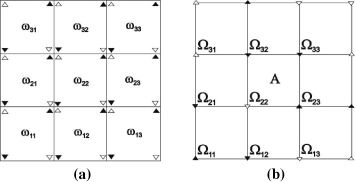
Figure 10. Random quadrupole lattice in a model 2D polycrystal (a) and corresponding array of junction disclinations (b).
Download figure:
Standard image High-resolution imageA disclination quarupole ij with its center located at a point (xj,yi) = ([j-1/2]d, [i-1/2]d) induces a stress field the components of which can be written in a general form as σα β ij (x,y) = ωij Gα β (x - xj ,y- yi ), where Gα β are the functions calculated elsewhere [3]. Therefore, the total stresses at a point (x,y) of a probe grain A (figure 10(b)) will be equal to

where N determines the number of quadrupoles included in the calculation of the stresses. As the sum (10) is composed of independent random variables, its mean value and dispersion will be equal to


Based on equation (12), the root mean square (rms) internal elastic strain in the model polycrystal was calculated in [11]. In these calculations it was shown that 99% contribution into the stresses and elastic energy of the system is given by neighbors located in the first five coordination layers, thus N = 11 was used. The calculations yielded the following simple equation for the internal elastic strain:

The elastic energy of the array of disclination quadrupoles per one quadrupole consists of two parts: the self-energy of a quadrupole and energy of its interaction with other quadrupoles. The interaction energy between two quadrupoles is proportional to the multiple of two independent variables ωij
ωkl and has zero mean value. Therefore, the total interaction energy is equal to zero and the energy of random quadrupole lattice is equal to the simple sum of self energies of the quadrupoles. Using equation (3) one has then  per one grain of the 2D polycrystal. The excess specific elastic energy of GBs related to disclinations then will be equal

Assuming 〈Ω 2〉1/2 ≈ 2°, i.e. half of the critical strength for d = 200 nm calculated above (ωc ≈ 4°), equations (13) and (14) yield the following estimates: εi ≈ 0.3% and γex ≈ 0.4 J m- 2. These estimates are comparable to the characteristics of NS metals processed by SPD [32,33].
7. Grain boundary diffusion controlled relaxation of triple junction disclinations
As extrinsic defects induced during plastic deformation, the triple junction disclinations relax and disappear at high temperatures. A model for the relaxation of a junction disclination dipole was analyzed in [34] and that for the relaxation of a disclination quadrupole in [35]. The results of these analyses are similar, and below we will consider the model for disclination dipole in more detail.
Consider a dipole of junction disclinations which consists of a finite wall of edge grain boundary dislocations (GBDs) on a probe GB (central vertical boundary in figure 11). Let the initial strength of disclination dipole be Ω 0 = b/h0, where b is the Burgers vector magnitude of GBDs and h0 their initial spacing. The arm of the disclination dipole is equal to the GB length: L = 2a. When the temperature is high enough and diffusion is allowed, the GBDs, under their mutually repulsive interaction forces, will climb to the junctions. They can leave the GB through the junction, if a dislocation splitting at the junction occurs. If the dihedral angle between the adjoining GBs is obtuse, that is the case in real polycrystals due to the equilibrium of interfacial tensions, energetically favorable splitting of a GBD 1 will result in two dislocations 2 and 3, which can glide in corresponding GBs. The latter can easily quit the junction by glide and annihilate with opposite dislocations gliding from the opposite junctions. If the latter are absent, the dislocations can glide towards the opposite junctions and GBs (e.g., reaction  ). In this case a gliding GBD 5 will again be formed and quit the corresponding junction without any diffusion. Therefore, dislocation 1 can be excluded from a consideration of the process as soon as it reaches the junction. The same processes symmetrically occur near the bottom junction of the probe GB. As a result of the disappearance of one GBD near each of the two junctions the strength of the dipole diminishes to a value b/a . Then, the next head dislocations approach the junction by climb and the process is repeated.

Figure 11. (a) A model of relaxation of a junction disclination dipole; the arrows indicate the direction of dislocation movement; (b) dependence of the relaxation rate of disclination dipole on the number of dislocations left; initial number of dislocations is 5 for curve 1, 10 (curve 2), 20 (curve 3), and 50 (curve 4).
Download figure:
Standard image High-resolution imageFrom the above consideration it is clear that the whole process of relaxation is controlled by the climb of GBDs to the junctions. Since this occurs in a high-angle GB, the diffusion coefficient of which, Db, is much higher than the lattice diffusion coefficient; this process is completely controlled by GB diffusion.
The process can be analyzed in two approaches: the continuum approach (dislocations have infinitesimal Burgers vectors) and the discrete dislocation approach (the dislocations have a finite Burgers vector). The results obtained in the two approaches are similar [34], which is why the physically most clear discrete dislocation model is considered below.
Let the initial GBD wall contain N = 2n + 1 dislocations with Burgers vector magnitude b with positions y±i = 0, ± h0 , ± 2h0 ,..., ± nh0. For the climb rate of ith dislocation one can write [36] vi = (Jl - Ju )Va /bn , where Jl is the vacancy flux from the lower, (i - 1) st dislocation to the i th one and Ju the flux from the i th dislocation to the upper, (i + 1) st one. According to Fick's first law, the vacancy flux density is equal to j = - Db ∇ μ /VakT. In the present case, the gradient of chemical potential for vacancies is related to the gradient of normal stresses by an equation ∇ μ = ∇ σxx Va [36], and the vacancy flux will be equal to J = jδ = - δ Db (∂ σxx /∂x) /kT, where δ is the GB diffusion width. Substituting this into the equation for dislocation velocity, one obtains

for each i = 1, 2, ..., n- 1 , where σxxi is a normal stress near the core of the i th dislocation. For i = n equation (15) contains only a flux from the (n - 1) st dislocation, that is the second term in the brackets. Due to symmetry, the central dislocation (i = 0) is immobile. The stresses in equation (15) are calculated by simply summing the stresses of individual dislocations except for the self-stresses:
To solve equations (15) numerically, dimensionless coordinates and time have been introduced as follows:  and τ = [4 δ Db
GVa /π (1 - ν )kTL3] t.
and τ = [4 δ Db
GVa /π (1 - ν )kTL3] t.
When a dislocation approaches a junction, it is excluded from the system and n is decreased by 1. The relative relaxation rate for the misorientation angle of the wall, dΩ /Ω dt , is calculated from the time interval Δt in which two neighbor dislocations successively approach a junction: dΩ /Ω dt = 1/(n + 0.5)Δt.
Figure 11(b) plots the dependence of the relative relaxation rate dΩ /Ω dt on the number of dislocations remaining in the wall for four initial values of this number 2n0 + 1 . One can see from the figure that for each n0 there is a transition stage of relaxation of different duration followed by a stationary stage. For sufficiently large n0 this stage is characterized by a constant value of the relaxation rate, [π (1 - ν )kTL3 /4 δ Db GVa ](dΩ /Ω dt) ≈ 8. Therefore, for the misorientation angle of a discrete GBD wall one obtains the following equation:

In the continuum approach a numeric coefficient 163 was obtained instead of 125 [34]. Similar calculations for the disclination quadrupole give the numeric coefficient 100 [35]. Thus, very similar results are obtained in different approaches. For further estimates, the value 100 will be used.
Since, according to equations (1)–(3), the energy of disclinations and its multipoles is proportional to the square of the strength of disclinations, Eel ∝ Ω 2, one has dEel /Eel dt = 2dΩ /Ω dt , and the characteristic time for the relaxation of elastic energy will be half of that for the strength of defects. Therefore, we will have the following equation for the relaxation of elastic energy of a junction disclination quadrupole in deformed polycrystals:

with the relaxation time

This estimate will be used in the next section to analyze the relationship between the relaxation of junction disclinations and the measured GB diffusion coefficient in nanostructured materials.
8. Triple junction disclinations and grain boundary diffusion in nanostructured materials
8.1. Enhancement of grain boundary diffusion due to junction disclinations
Since triple junction disclinations induce high internal stresses, via these stresses they can have a significant effect on the grain boundary diffusion coefficient in nanostructured materials. This effect was studied in [37].
Consider a single semi-infinite grain boundary whose plane is normal to the surface of a polycrystal. Let the y-axis of the coordinate system lie along a normal to the surface with the positive direction inside material. On the surface, there is a layer of radio-tracer atoms. The GB is subject to non-uniform internal stresses whose derivatives along the y-axis are assumed to be constant. In the presence of a gradient of the hydrostatic stress,  , where σ = (σxx + σyy + σzz )/3, the flow of tracer atoms will be given by a relation j = - Db [∂c/∂y + (Va /kT) c (∂ σ /∂y)], where Db is the GB diffusion coefficient, c the concentration of tracer atoms and Va the atomic volume. The diffusion process will then be described by an equation

For initial conditions c(y,0) = 0 (y > 0 ) and c(y,0) = c1 (y < 0) the solution to equation (20) is [38]

where c(0,0) = c1 /2 ,  and v = (Db
Va /kT)(∂ σ /∂y) is the average drift speed of atoms in the constant stress gradient.
and v = (Db
Va /kT)(∂ σ /∂y) is the average drift speed of atoms in the constant stress gradient.
As follows from equation (21), a positive gradient of the stress shifts the concentration front to the right to a value of vt thus leading to an increase of the penetration depth. Opposite stress gradients shift this front to the left only for positive values of y, since the stresses act only in the material and the layer of diffusate is considered to be stress free. That is, the effect is asymmetric with respect to the sign of ∂ σ /∂y.
Consider now a model polycrystal in which the GBs are considered to form chains approximately normal to the surface. The stress gradient in each chain is assumed to be constant, but there is a random distribution of the stresses in the ensemble of chains such that the parameter v can assume any value between maximum opposite and maximum positive ones:

Assuming an even distribution of the drift speeds in this interval, one can calculate the average concentration of tracer atoms in any section of the polycrystal parallel to the surface:
The graph of this function for vmt = 10Lef is presented in figure 12(a) (curve 1). For a comparison, the concentration profiles for a non-stressed grain boundary (curve 2) and for the GB chain experiencing the maximum positive stress gradient (vt = + 10Lef ) (curve 3) are given too.

Figure 12. (a) Average concentration of tracer atoms according to equation (23) at vmt = 10Lef (curve 1), to compare with the concentration profiles along non-stressed grain boundaries (curve 2) and the fastest grain boundary chain (curve 3); (b) average penetration profiles plotted in terms of the logarithm of concentration versus the square of distance; vmt = 0 (curve 1), vmt = 4Lef (2), and vmt = 10Lef (3). The dashed curves correspond to a stress free GB with an effective diffusion coefficient equal to 10Db (4) and 100Db (5).
Download figure:
Standard image High-resolution imageThe distribution of stress gradients results in a much more flat concentration profile as compared to the sharp profiles characteristic for the diffusion along GBs subject to a constant or zero stress gradient. Furthermore, the stresses can significantly increase the penetration depth. This increase is determined by the value of the ratio vmt/Lef. The higher this ratio is, the more is the effect of stresses on the penetration depth.
To extract the diffusion coefficient from experimental concentration profiles, the latter are usually plotted in terms of logarithm of concentration versus the square of the distance from the surface. For several values of the ratio vmt/Lef such graphs are presented in figure 12(b). If one does not take into account the internal stresses, the diffusion coefficient will be determined by fitting equation (21) with vt = 0 to the concentration profiles. This results in an effective diffusion coefficient Dbef that is different from the intrinsic GB diffusion coefficient Db. The latter should be determined by fitting the concentration profiles to equation (23). Figure 12(b) illustrates the relation between the two coefficients. The concentration profile for a stress free GB with Dbef = 10Db is similar to that for the stressed polycrystal in which vmt/Lef = 4 . If the ratio vmt/Lef is equal to 10, the corresponding effective diffusion coefficient amounts to 100 times the GB diffusion coefficient. Thus, orders of magnitude in excess of the GB diffusion coefficient as compared to that in equilibrium boundaries can be detected when processing the experimental data by the solution of an ordinary diffusion equation.
For the strength of junction disclinations ω = 3° at temperatures about T = 400 K the parameter vmt/Lef can have a value up to 6 [37]. Therefore, at least one order of magnitude increase of the apparent GB diffusion coefficient can be caused by the stress gradients due to junction disclinations. As has been suggested in [37], a random distribution of the strength of disclinations can result in an even larger enhancement of the GB diffusion coefficient.
8.2. Recovery of the grain boundary diffusion coefficient
In order to measure the GB diffusion coefficient experimentally, diffusion annealing is carried out at a sufficiently high temperature that would provide an appreciable penetration of tracer atoms into the material under study. Under these conditions, the junction disclinations relax as discussed in section 7. This relaxation is accompanied by a gradual recovery of the grain boundary diffusion coefficient. Thus, an actual diffusion experiment with nanostructured materials is necessarily accomplished with a time-dependent diffusion coefficient. This can significantly affect the experimentally measured diffusion coefficient. The relation between the recovery of nonequilibrium GB structure caused by disclinations and GB diffusion coefficient was analyzed in [39].
Phenomenologically, the relationship between the GB diffusion coefficient and excess energy of GBs was given by Borisov's equation [40]

where Dbne and Dbeq are, respectively, diffusion coefficients along nonequilibrium and equilibrium GBs, and Δ ε is the excess GB energy per atom.
Considering the excess energy of GBs related to disclination quadrupoles, equations (18) and (19) can be re-written for the recovery of Δ ε

If the gradient of diffusing matter has the direction along the x-axis lying on the GB plane, the GB diffusion equation then can be re-written as follows:

This equation can be solved by the following substitution:

As a result, we obtain the standard diffusion equation

For the diffusion regime 'C' mostly used during the measurements of diffusion coefficient in nanostructured materials [41], the solution to equation (28) is
Taking account of equation (27), equation (29) can be transformed into a function of the coordinate x and time t.
Experimentally, the diffusion coefficient is normally determined from constructed concentration profiles, i.e. from the dependences of the tracer concentration on the diffusion depth at the instant of time corresponding to the time of diffusion annealing. As follows from equation (29), upon changing over from the variable τ to the variable t, the character of dependence of the concentration on the depth x remains unchanged. Consequently, the time dependence of the diffusion coefficient does not affect the functional form of the concentration profiles. However, from the analysis of the experimental profiles constructed in the c–t coordinates, one will determine the effective (apparent) diffusion coefficient, which is related to the intrinsic diffusion coefficient by the equation Dbeq τ = Deft, that is

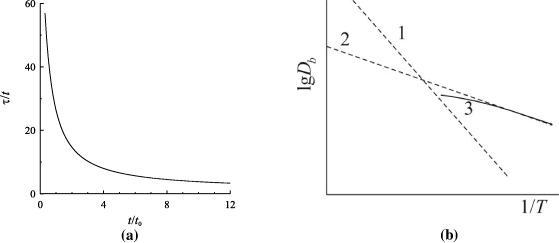
The time dependence of the ratio τ (t)/t for the case, when the initial enhancement of the diffusion coefficient is equal to Dbne /Dbeq = 102, is presented in figure 13(a). From this figure one can see that for annealing times much exceeding the relaxation time t0, τ ≈t and Def ≈Dbeq, i.e. diffusion experiments yield the intrinsic diffusion coefficient. However, if t ≪ t0 and  , Def ≫ Dbeq, i.e. for too short diffusion times one will measure an effective diffusion coefficient much exceeding the intrinsic one. This will happen for too short a time of annealing at low temperatures. In the intermediate cases the diffusion time is of the order of relaxation time, and with increasing temperature and/or annealing time the ratio Dbne /Dbeq will decrease. As one can see from figure 13(a), for Dbne /Dbeq = 100 even after annealing in time interval t ≈ 3t0 the effective diffusion coefficient is still one order of magnitude higher than the true coefficient.
Figure 13. (a) Time dependence of the ratio τ/t, which indicates the ratio of effective and intrinsic diffusion coefficients; (b) inverse temperature dependence of diffusion coefficient: (1) equilibrium GBs (high temperatures); (2) nonequilibrium GBs (low temperatures); (3) relaxing GBs (intermediate temperatures).
Download figure:
Standard image High-resolution image
The considered behavior of GB diffusion coefficient is confirmed by the experimental observations. For example, in GBs of nanocrystalline iron the measured self-diffusion coefficient decreases one order of magnitude when the annealing time at the same temperature 473 K is increased from 1.5 h to 3 days [42].
Recovery of the GB diffusion coefficient during annealing can result in a strong decrease of the apparent activation energy for GB diffusion. If the activation energy for diffusion along equilibrium GBs is equal to Eb, for nonequilibrium GBs it will be Eb - Δ ε. Figure 13(b) illustrates schematically the dependences  with the activation energies Eb (line 1) and Eb - Δ ε (line 2). When increasing the temperature of diffusion experiments, the dependence of apparent diffusion coefficient on inverse temperature will first follow line 2, then, after full relaxation of GBs, line 1. At intermediate temperatures the relaxation decreases the GB diffusion coefficient as compared to line 2, so the latter will follow line 3. The slope of this line is less than that of line 2, so the experimentally measured activation energy is even less than Eb - Δ ε. This explains the experimentally established fact that in NS materials the activation energy of GB diffusion is often twice less than in ordinary polycrystals [43]. For some specific combinations of the relaxation and diffusion times and temperature, even the observation of negative activation energy may be possible.
9. Conclusions
The present short review shows that disclinations are necessary elements of the structure in NS materials processed by SPD methods. They can accumulate at triple junctions of grains and play a key role in the subdivision of grains during plastic deformation. After SPD, they are inherited by the as-processed material and play important role in its structure and properties. The disclination approach allows one to calculate the internal elastic strains, excess GB energy in nanomaterials and also to explain the enhancement of GB diffusion in these materials. At elevated temperatures disclinations relax causing the recovery of GB energy and diffusion coefficient. In order to measure the true GB diffusion coefficient, the diffusion annealing time must be much longer than the relaxation time for junction disclinations.
Acknowledgment
The author is grateful to the Russian Foundation for Basic Research for support under grant no. 12–08–93001-Viet_a.
Footnotes
- *
Invited talk at the 6th International Workshop on Advanced Materials Science and Nanotechnology IWAMSN2012, 30 October–2 November, 2012, Ha Long, Vietnam.