
Abstract
The catalysts TiO2 and TiO2 doped with Fe and V were prepared using the sol–gel method. TiO2-modified samples were obtained in the form of a thick film on pyrex glass sticks and tubes and were used as catalysts in the gas phase photo-oxidation of p-xylene. The physico-chemical characteristics of the catalysts were determined using the methods of Brunauer–Emmett–Teller adsorption, x-ray diffraction, and infrared, ultraviolet and visible and Raman spectroscopies. The experimental results show that the introduction of V did not expand the region of light absorption, but slightly reduced the size of the TiO2 particles, and reduced the number of OH-groups, which should decrease the photocatalytic activity and efficiency of the obtained catalysts compared to those of pure TiO2. The Fe-doped TiO2 samples, in contrast, are characterized by an extension of the spectrum of photon absorption to the visible region with wavenumbers λ up to 464 nm and the values of their band gap energy decreased to lower quantities (up to 2.67 eV), therefore they should have higher catalytic activity and conversion efficiency of p-xylene in the visible region than the original sample. For these catalysts, a combined utilization of radiation by ultraviolet (λ = 365 nm) and visible (λ = 470 nm) light increased the activity and the yield in p-xylene conversion by a factor of around 2–3, as well as making these quantities more stable in comparison with those of TiO2–P25 Degussa.
Export citation and abstract BibTeX RIS

Content from this work may be used under the terms of the Creative Commons Attribution 3.0 licence. Any further distribution of this work must maintain attribution to the author(s) and the title of the work, journal citation and DOI.
1. Introduction
Photocatalytic oxidation (PCO) is a very attractive technology for the degradation of organic compounds in environment cleaning. This technology belongs to the simple, economically feasible and applicable measures of environment protection. In PCO processes the degradation of polluted organic waste into inorganic compounds is carried out utilizing radiation energy, from natural or artificial light sources, with heterogeneous catalysts. In many cases, under natural conditions, PCO processes can convert simple organic compounds directly into carbon dioxide and water with participation of molecular oxygen. However, the processes of degradation for complex pollutants are usually more difficult; they occur very slowly and undesirable intermediate compounds may be formed.
Titanium dioxide, TiO2, is considered to be the most important heterogeneous photocatalyst due to the following remarkable advantages: (i) it shows high efficiency in the degradation of polluted compounds; (ii) it can use visible light and/or near-ultraviolet light; (iii) it operates at normal conditions of temperature and pressure; (iv) it is stable under chemical interactions and light radiation; and (v) it can be mixed with additional supporting agents.
TiO2 exists in two main crystalline forms: anatase and rutile. The value of the optical energy band gap in the anatase phase is 3.23 eV, while this value in the rutile form is only 3.0 eV [1]. For one substrate, and under the same reaction conditions, various forms of TiO2 should express dissimilar photocatalytic activities. This variety in photocatalytic properties can be attributed to differences in the characteristics of the photocatalyst sample, such as morphology, crystalline phase, surface specific area, size of the agglomerated particles, density of surface OH-groups of TiO2, etc. TiO2 in the anatase phase is characterized by a higher photocatalytic efficiency compared to the rutile and brookike phases [2, 3] because the former has a higher value of surface specific area and its crystalline structure is more favorable for photochemical processes. One of the main reasons for the higher efficiency is probably the higher reduction potential of photogenerated electrons in the former than in the latter, i.e. the bottom of the conduction band of anatase is located 0.1 V lower than that of rutile [4–6]. With an optical energy band gap of 3.2 eV, under utraviolet radiation TiO2 nanoparticles have a strong ability to decompose organic compounds. Molecules of water adsorbed on the surface of TiO2 are oxidized by photo-generated holes to form a strong oxidizing agent—hydroxyl radicals ( ). Furthermore, these
  participate in the reaction with organic compounds.
The photocatalytic system TiO2-UV has been extensively studied in its application to the treatment of environmental waste. However, only 3–5% of sunlight is UV-radiation, capable of activating TiO2 to become a photocatalyst [7]. Many researchers have tried introducing additives to the structure of TiO2 in order to make it able to function as an active photocatalyst in a wider zone of solar radiation, including visible light. Numerous studies have been performed on doping transition and rare earth metals into TiO2 [8]. The results indicate that some doped metal ions can extend the working zone of TiO2 toward the region of visible radiation. The reason for this is that ions of several metals are able to penetrate into the structural network of TiO2 to form donor and acceptor levels in the space of its band gap (impurities). Also the ions of transition metals doped into TiO2 are able to generate defects on its surface that should lead to changes in its photocatalytic properties. The addition of small amounts of transition metals, such as V, Fe and Cu, should reduce the value of the band gap energy and the rate of the electron–hole recombination process, and move the zone of photon absorption to the region of longer wavelengths [9]. The exchange of electrons (or of holes) between the doped metals and TiO2 is likely to be capable of making the process of charge recombination slow down. The migration of photogenerated electrons into particles of the doped metal can increase the lifetime of holes and suppress the charge recombination, thereby facilitating the process of photocatalytic degradation. However, when the concentration of doped ions exceeds an optimal value, photocatalytic activity decreases, because at high concentrations the doped atoms become the centers of charge recombination and reduce the efficiency of catalytic action.
Generally, when added to the network of TiO2, the atoms of metals and non-metals tend to reduce the band gap energy of the TiO2 in different directions. For metals such as Fe, Cr and V, the level of d-electron energy is lower than the 3d-orbital energy of TiO2 and is located between the conduction and valence bands of the semiconductor, so their addition should lower the conduction band, reducing the band gap energy of TiO2 [10] and the modified catalysts should operate in a greater light absorption wavelength than the pure TiO2 catalyst [11].
If metal ions replace Ti4+ ions in the TiO2 structure, when TiO2 is modified by nitrogen, the nitrogen atoms have been confirmed to either replace the oxygen atoms in the TiO2 network, or to be interstitial inside the bonds of the oxygen atoms [12]. Because the p-orbital energy of nitrogen is higher than that of oxygen in the presence of nitrogen (instead of oxygen), the valence band of TiO2 rises, reducing the value of band gap energy of the semiconductor compound [12].
Different methods are used to produce nanomaterials and nanofilms, from relatively simple to quite complex, including the method of physical vapor deposition (PVD), chemical vapor deposition (CVD) and many others. The sol–gel method allows the preparation of small semiconductor systems. This method has the following advantages: (i) it allows one to obtain single-phase multi-component systems with high uniformity and high chemical purity; (ii) the process requires temperatures lower than those in the conventional powder method; (iii) it can generate powder with large specific surface area and high activity due to small particle size; (iv) the rheological properties of the sol and gel allows the creation of specific configurations such as fibers, thin films or composites.
In summary, the amount of research on the preparation of nanocatalysts for photo-oxidation has rapidly increased since the last decade of the 20th century, due to the advantages of photocatalytic processes [13]. This research direction is clearly the focus of particular interest. The purpose of this paper is to obtain powder and thin films of TiO2 nanoparticles by the sol–gel method and modify TiO2 with V and Fe in order to change its physico-chemical characteristics and to improve photocatalytic activity in the deep oxidation of volatile organic compounds under the radiation in the visible light region with the aim of raising the efficiency of exhaust treatment under sunlight.
2. Experimental setup
2.1. Preparation of transparent  gel by the sol–gel method (procedure I)

Tetraisopropyl orthotitanate Ti (OC3H7)4 (TTIP) was added to an ethanol-HNO3 solution with a pH of about 3–4; the solution was stirred for 1 h. A transparent mixture was obtained (sol). The mixture was added to a quantity of water, stirred and heated with reflux at 80 °C for about 2 h, after which a highly viscous mixture was obtained. By keeping the mixture overnight one can achieve a transparent soft gel mass. After filtration, washing, drying and calcining at 500 °C for 3 h the powder product was obtained and denoted as Ti.
2.2. Preparation of – catalysts by the sol–gel method (procedure II)


TTIP was dissolved in ethanol solvent in the appropriate ratio. Two milliliters of ammonium vanadate solution in non-ionic water (with concentrations ranging from 0 to 0.005 M) was added. The mixture was acidized by a solution of HNO3 to reach a pH of about 3–4, and agitated at room temperature until a clearly homogeneous and highly viscous solution was obtained. The content of V2O5 (V2O5/TiO2) was adjusted to be 0.028, 0.084, 0.110, 0.188, 0.802 and 1.604 mol% to obtain the catalyst samples 028V–Ti, 084V–Ti, 110V–Ti, 188V–Ti, 802V–Ti and 1604V–Ti, respectively.
2.3. Preparation of catalysts by the sol–gel method (procedure III)

Three milliliters of TTIP was dissolved in 50 ml of HNO3-ethanol mixture (pH 3). The obtained solution must be clear and transparent. The sol was made by adding Fe(NO3)3 solution over 90 min. The content of Fe2O3 (Fe2O3/TiO2) was adjusted to be 0.025, 0.05, 0.10, 0.50, 1.00 and 2.00 mol% to obtain the catalyst samples 025Fe–Ti, 050Fe–Ti, 100Fe–Ti, 500Fe–Ti, 1000Fe–Ti and 2000Fe–Ti, respectively. The sol was kept at room temperature until a complete hydrolysis of the TTIP and the gel had formed (24 h). The obtained precipitates were filtered and washed with ethanol and distilled water. The samples were dried at 110 °C for 1 h and then calcined and crystallized at 550 °C for 4 h.
Pyrex glass sticks of 6 mm diameter or closed Pyrex glass tubes of 19 mm diameter, 230 mm length, were used as supports for the catalysts. The surfaces of the supports were treated with 1% hydrofluoric acid for about 12 h, washed with distilled water to completely remove the acid, then soaked in a 1% solution of potassium hydroxide in methanol for 12 h. They were then washed with distilled water again, followed by washing with alcohol or acetone. They were then dried and calcined at 450 °C. For the glass sticks the area of coated and lighted catalyst film is 68 cm2, the weight of the material coated on a glass stick is 15 mg and the total weight of the catalyst material used in the reaction is 30 mg (two sticks). For the closed glass tubes the weight of the material coated on a tube is 5 mg, 300 nm thick and the lighted area is 144.5 cm2.
The TiO2 or modified TiO2 catalyst films coated on the pyrex glass sticks and tubes are obtained by using a dipping method from suspension (for P25) or colloidal solutions (for the rest of the samples).
The suspension solution was prepared as follows. The TiO2-Degussa P25 powder was dispersed in water to form a suspension solution. The glass sticks were dipped into the suspension solution to achieve a film. The necessary amount of catalyst material in the film was obtained after several dipping operations. After being removed from the solution, the sample was dried naturally in air and then dried at a temperature of about 100–105 °C for 2 h. After the last dipping operation, when the necessary amount of material has been reached, the drying process was followed by a calcination process at 450, 550 or 900 °C for about 4 h in air with a flow velocity of 6 l h−1 and the samples were denoted as P25-450, P25-550 or P25-900.
The creation of the catalyst films on the Pyrex glass tubes using the method of dipping in colloidal solutions was done in a similar way, albeit the solutions containing the catalyst materials were colloidal ones of TiO2 or modified TiO2. After the last dipping operation, when the necessary amount of material had reached, the drying process was followed by calcination at 450 °C for 4 h in air with a flow velocity of 6 l h−1.
The content of vanadium and iron in the catalysts was determined by atomic absorption spectroscopy (AAS) using the Shimadzu AAS 6800 apparatus. The thickness of the layer was determined by the alpha-step method. The characterization of the catalyst samples was carried out by the methods of Brunauer–Emmett–Teller (BET) adsorption (CHEMBET 3000), x-ray diffraction (XRD; XD 5A-Shimadzu), field emission scanning electron microscopy (FE-SEM; HITACHI S-4800), Fourier transform–Raman (FT-Raman; Perkin-Elmer 2000), UV–Vis absorption (Jassco V-550) and infrared (IR)-spectroscopy (BRUKER VECTOR 22).
The photocatalytic activity of the samples was tested in the gas phase deep oxidation of p-xylene at 40 °C in a micro-flow reactor. The radiation sources were a UV lamp (λ = 365 nm, power of 8 W) and 80 pieces of light emitting diode (LED) (λ in the range 400–510 nm, total power of 19.2 W). The activity of the catalysts was evaluated using results obtained from analysis on the gas-chromatograph GC Agilent 6890 Plus, a flame ionization detector, and the capillary column HP-1 with methyl siloxane (30 m, 0.32 mm, 0.25 μm).
3. Results and discussion
3.1. Catalyst -Degussa P25

For the sample TiO2-Degussa P25 (Merck, Germany) with a pH value in the range 3.5–4.5, the purity of 99.5% and the compression density of 130 g l−1 were used. The influence of the treatment temperature on the physico-chemical properties of the TiO2-Degussa P25 (powder) are shown in table 1.
Table 1. Characteristics of the sample TiO2 P25.
| Characteristics | Treatment temperatures °C | |||
|---|---|---|---|---|
| Without treatment | 450 | 550 | 900 | |
| SBETa, (m2g−1) | 45.5 | 50 | 19.5 | 10 |
| dTiO2b, (nm) | 30 | 33 | 40 | – |
| λc, (nm) | 390 | 325–430 | 325–430 | 370–445 |
| EG d, (eV) | 3.18 | 3.18 | 3.18 | 2.99 |
| A/Re | 82.7/17.3 | 81.6/18.4 | 81/19 | 0.8/99.2 |
aSurface specific area. bParticle size. cWavelength of light absorption. dEnergy of band gap. eRatio of anatase/rutile phases.
The XRD patterns of the P25 sample after treatment at 450 and 550 °C (figure 1) are similar and one can observe only the characteristic peaks of the anatase and rutile phases. The content of the anatase phase in TiO2 was calculated according to the intensity of the characteristic peak of anatase IA at the angle 2θ = 25.3° and the content of the rutile phase, according to the intensity of the characteristic peak IR at the angle 2θ = 27.5°

Figure 1. XRD pattern of the samples TiO2 P25, treated at different temperatures (from bottom): untreated, treated at 450, 550 and 900 °C.
Download figure:
Standard image High-resolution imageAccording to the XRD patterns of the catalyst samples, the percentage of rutile phase content was calculated as follows [14]:

where, R is the percentage of rutile phase (%), IA is the integral intensity of the reflection peak (peak 101) characteristic of the anatase phase, IR is the integral intensity of the reflection peak (peak 110) characteristic of the rutile phase.
The size of the crystal grain can be calculated using the Scherrer formula [15]

where dTiO2 is the average size of the TiO2 particles, λ is the wavelength of x-ray radiation (λ = 1.5406 Å), K is a constant, usually taken as 0.94, β1/2 is the width of the characteristic peak (101) of anatase at full-width at half maximum (FWHM), in degrees, θ is the Bragg angle (101 peak of anatase), in degrees, and 57.3 is the conversion factor for transferring from degrees to radians.
The data in table 1 show that after calcination at 450 and 550 °C, the contents of the anatase and rutile phases are not different from those in the uncalcined samples. The value of the ratio of anatase/rutile in these samples is approximately 82/18. Thus, treatment at 550 °C did not cause any phase transition of TiO2 P25, but increased the particle size and reduced the specific surface area. Compared to the uncalcined sample P25, the specific surface area of the sample treated at 450 °C was not changed significantly, while the surface area of the sample treated at 550 °C decreased about 2.6 times and the grain size increased from 30 to 40 nm.
After calcination at 900 °C for 4 h almost all the anatase phase was transferred to the rutile phase. On the XRD pattern of this sample (figure 1), the characteristic peaks of anatase could barely be observed. This conclusion was also verified by UV spectral analysis. The UV spectra (figure 2) of the sample P25 before and after heating at 450 and 550 °C are similar, while the spectrum of the sample calcined at 900 °C shifted to the region of higher wavelengths. The bending point on the UV spectra for the first three samples was observed at 390 nm, while the bending point on the spectrum of the last sample was observed at 415 nm. Thus one can calculate the value of the band gap energy using the formula

where h is the Planck constant, c is the speed of light and λ is the wavelength of the absorbed light.
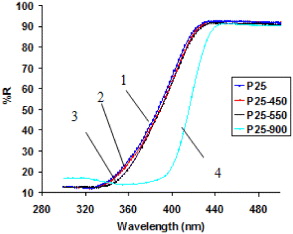
Figure 2. UV–Vis reflectance of the sample TiO2 P25, treated at different temperatures: untreated (1); treated at 450 °C (2), 550 °C (3) and 900 °C (4).
Download figure:
Standard image High-resolution imageFrom table 1 it follows that the value EG of the untreated sample and the samples calcined at 450 and 550 °C is 3.18 eV, but the sample calcined at 900 °C is characterized by a band gap energy of 2.99 eV. In addition, the slopes of the UV spectra 1, 2, 3 in figure 2 are gradual, while for the sample calcined at 900 °C the spectral curve is steep. This observation is consistent with the conclusion that the last sample calcined at 900 °C only contains the rutile phase. Thus, for the samples of TiO2 P25 treated at different temperatures, it is appropriate to use UV lamps in photocatalytic reactions.
The IR spectra (figure 3) also indicate a distinct feature of the sample TiO2 P25 treated at 900 °C compared to the samples calcined at 450 and 550 °C. As is known, the number of OH-groups on the surface of TiO2 is proportional to the intensity of the peak at about 3420 cm−1. On the samples treated at 450 and 550 °C one can observe two absorption peaks at 3418 and 1635 cm−1. The band concentrated at 3418 cm−1 can be ascribed to basic OH-groups [16] characteristic of the valence vibration of structural OH-groups with basicity. On the other hand, in the sample treated at 900 °C, the peak characteristic of the OH-group almost disappears. This fact can be explained by the fact that the TiO2 treated at 900 °C was dehydrated completely. Thus, the activation of TiO2 samples at 450 or 550 °C makes their surface cleaner and many more OH-groups should be formed.
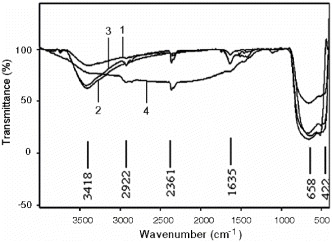
Figure 3. IR spectra of the sample TiO2 P25, treated at different temperatures: untreated (1); treated at 450 °C (2); 550 °C (3) and 900 °C (4).
Download figure:
Standard image High-resolution imageThe influence of water vapor on the photo-oxidation of p-xylene when using TiO2 P25 as a catalyst is shown in table 2. TiO2 catalyst films coated onto Pyrex glass sticks are obtained by the coat-dipping method from suspension solutions.
Table 2. Initial conversion extent of p-xylene at 40 °C on TiO2 P25, treated at 450 °C.
| Concentration of water vapor, (mg l−1) | Concentration of O, (mg l−1) | Conversion of p-xylene, (%) |
|---|---|---|
| 6.4 | 300 | 48.8 |
| 8.6 | 300 | 96 |
| 11.5 | 300 | 99.8 |
| 11.5 | 488 | 56 |
| 11.5 | 676.2 | 20 |
| 11.5 | 864.3 | 18 |
| 15.2 | 300 | 74.6 |
Reaction conditions: volume velocity 26 × 103 h−1, initial concentration of p-xylene in the flow 19 mg l−1, three UV lamps (λ =365 nm) with a capacity of 1170 lux.
As can be seen in table 2, the activity of the catalysts increased with water content up to 11.5 mg l−1. However, a further increase in water content led to a decrease of p-xylene conversion. This observation is consistent with results obtained in the PCO of toluene on TiO2 [17]. As is known, the role of water vapor is to continuously recover OH-groups consumed during the reaction. The presence of water is a necessary condition for the formation of  radicals. However, if the temperature is low, at high concentrations water molecules compete with molecules of the reactant in adsorption, which prevents contact between the reactant and the catalyst leading to a reduction of conversion.
Similarly, the dependence of p-xylene conversion on oxygen concentration is extreme and the highest value was observed when oxygen concentration reached 300 mg l−1, with a further increase of oxygen concentration tending to decrease p-xylene conversion. This result is similar to the previous data obtained by other authors in the photo-oxidation of benzene [18] and trichloroethylene [19]. According to these authors, in photo-oxidation, oxygen is an irreversible photogenerated electron acceptor, preventing the recombination of electrons in the conduction band with positively photogenerated holes in the valence band which extends the lifetime of the holes, leading to an increase of catalytic activity.
From above results one can propose appropriate conditions for the photocatalytic process in the complete oxidation of p-xylene as follows: TiO2 catalyst treatment at 450 °C; reaction temperature 40 °C; and concentrations of p-xylene, water vapor and oxygen at 19, 11.5 and 300 mg l−1 respectively.
3.2. catalysts doped with V2O5

The IR spectra as well as the Raman spectra of the TiO2 samples modified by V2O5 did not show any characteristic peaks of vanadium oxide. Also in the IR spectra (not shown), the characteristic peak of OH-groups at the 3418 cm−1 region appeared with very low intensities, much lower than those in the IR spectra of pure TiO2 (see figure 3). This fact indicates the poverty of OH-groups on the modified samples. As seen in figure 4, in Raman spectra of the studied samples V–Ti, one can only observe peaks at 147, 398, 518 and 640 cm−1, characteristic of the anatase phase of TiO2, but no characteristic peaks of vanadium were observed, which is consistent with the results of the XRD analysis (figure 5). According to the XRD patterns, the phase composition of the TiO2 samples modified by vanadium with a content of V2O5 below 0.1 and 1.604% is similar to that of pure TiO2; the content of the anatase phase is above 90%, the rest is rutile phase. In samples with average contents of V2O5 (0.188–0.802%), TiO2 exists in the entire anatase phase.

Figure 4. Raman spectra of TiO2 modified by V2O5.
Download figure:
Standard image High-resolution image
Figure 5. XRD patterns of TiO2 samples modified by V2O5 (from bottom): Ti, 028V–Ti, 084V–Ti, 110V–Ti, 188V–Ti, 802V–Ti, 1604V–Ti.
Download figure:
Standard image High-resolution imageFrom the results in table 3 it follows that, using the sol–gel method, one can obtain samples of TiO2 and TiO2 doped by V2O5 with a highly crystalline structure and with 90% or more of the anatase phase. The particle size of pure TiO2 is quite large (∼30 nm). When V2O5 is added, with the content not exceeding 0.1%, the particle size changes little, to about 28–29 nm. An increase of V2O5 content up to 0.188–1.604% leads to a reduction of particle size to 21–24 nm. In samples 188V–Ti and 802V–Ti the rutile phase does not exist. This result is consistent with the FE-SEM image of the 028V–Ti and 110V–Ti samples (figure 6). In figure 6 it can be seen that the catalyst particles of sample 110V–Ti have a very uniform size, of about 28–29 nm, indicating a state where vanadium ions are either inserted into the network of TiO2 or are highly dispersed in the catalyst sample. The thickness of the TiO2 layer (measured using the Alpha-Step IQ surface profiler) for all of the studied samples was identical in the range 283–288 nm regardless of the V2O5 content in the samples.
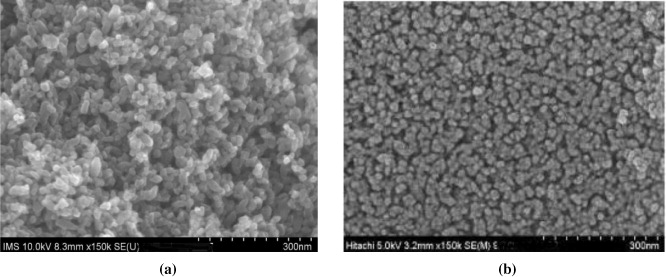
Figure 6. FE-SEM images of sample 028V–Ti (a) and 110V–Ti (b).
Download figure:
Standard image High-resolution imageTable 3. Physico-chemical characteristics and photocatalytic activity of TiO2 and TiO2 doped by V2O5 a.
| Characteristics | Catalysts | ||||||
|---|---|---|---|---|---|---|---|
| Ti | 028V–Ti | 084V–Ti | 110V–Ti | 188V–Ti | 802V–Ti | 1604V–T | |
| A (%) | 93.2 | 92.04 | 90.62 | 91.87 | 100.00 | 100.00 | 90.34 |
| R (%) | 6.8 | 7.96 | 9.38 | 8.13 | 0.00 | 0.00 | 9.66 |
| dTi, (nm) | 30 | 29 | 29 | 28 | 23 | 21 | 24 |
| λ, (nm) | 387 | 428 | 421 | 413 | 398 | 390 | 385 |
| EG, (eV) | 3.2 | 2.9 | 2.94 | 3.0 | 3.1 | 3.2 | 3.22 |
| Xob, (%) | 91.7 | 62.1 | 58.9 | 48.4 | 49.3 | 49.0 | 45.5 |
| Yc, (g g−1 of catalyst) | 8.1 | 5.4 | 4.9 | 4.6 | 4.5 | 4.3 | 4.2 |
aReaction conditions: 40 °C; volume velocity of the flow 156 × 103 h−1; initial concentrations of p-xylene, oxygen and water vapor 19 mg l−1, 300 mg l−1 and 11.5 mg l−1 , respectively; lighting by two UV lamps (λ = 365 nm) with a total ligh intensity of 872 lux. bInitial extent. cYield of p-xylene decomposition for 60 min.
The UV–Vis spectra of the catalyst samples (not shown) indicate that in the near-UV region (λ = 360–400 nm), the light absorption spectra of the modified samples tend to move forward to the region of longer wavelengths but this tendency is very weak. The spectral lines of the samples containing not more than 0.110% V2O5 have bending points on the UV–Vis spectra at slightly longer wavelengths of light absorption (table 3). This means that the samples mentioned are also able to absorb photons in the visible region and have lower values of band gap energy. However, the capacity to absorb light in the ultraviolet region of the samples containing from 0.188 to 1.604% of V2O5 is the same and approximately equal to that of the pure TiO2 sample. The sample containing 0.028% of V2O5 is characterized by having the longest absorption wavelength, the lowest value of band gap energy and the brightest bluish color. For the rest of the TiO2-modified samples, the absorption wavelength is shortened compared to that of the sample 028V–Ti, the value of band gap energy gradually increases, and the color gradually fades until these characteristics are similar to those of pure TiO2. This can be explained as follows: in sample 028V–Ti, part of the vanadium is inserted into the lattice of TiO2 in the form of V4+ ions to form links V–O–Ti as the defects, enabling the reduction of the band gap energy and, as a result, extending the light absorption of the catalyst towards the visible range.
Data on the activity of the V–Ti catalyst samples in p-xylene photo-oxidation are presented in table 3. From table 3 it follows that under the irradiation of UV light, the values of the initial conversion and yield obtained on modified catalysts in p-xylene conversion for 60 min on 1 g of catalyst are lower than those for pure TiO2. Among the modified catalysts, sample 028V–Ti expressed the highest efficiency in p-xylene conversion as it had the lowest value of band gap energy.
Thus, doping V into TiO2 samples using a sol–gel method led to the reduction of their particle size from 30 to 21 nm, but created samples with low concentrations of OH-groups, so that the photocatalytic activity as well as the stability of these catalysts decreased.
3.3. Catalysts TiO2 doped with Fe
The XRD patterns (figure 7) of the catalyst samples show only the characteristic peaks of the anatase (2θ = 25.3°) and rutile (2θ = 27.5°) phases without any characteristic peaks of Fe2O3. This result indicates that some Fe3+ ions are probably able to replace Ti4+ ions in the crystal network of TiO2.
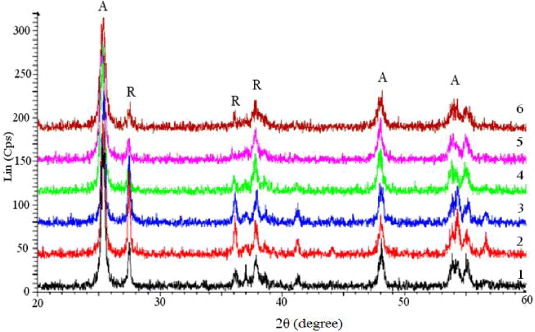
Figure 7. XRD patterns of the TiO2 samples doped with different contents of Fe2O3: (1) 025Fe–Ti; (2) 050Fe–Ti; (3) 100Fe–Ti; (4) 500Fe–Ti; (5) 1000Fe–Ti; (6) 2000Fe–Ti.
Download figure:
Standard image High-resolution imageThe Raman spectra of the Fe-doped TiO2 catalysts (figure 8) show peaks at 407, 522, 648 and 853 cm−1, characterizing the light absorption of anatase TiO2 [20]. No characteristic peaks of Fe2O3 are observed. It is very probable that the presence of Fe3+ ions in the lattice resulted in a shift of the absorption peaks characteristic of TiO2 to the region of higher wavenumber. The specific features of the Raman spectra of the Fe-doped TiO2 catalysts are the absence of the characteristic peak of anatase at 144 cm−1 and the appearance of a new peak at 853 cm−1. These facts confirm the idea about the penetration of Fe3+ ions into the network of TiO2 crystals.
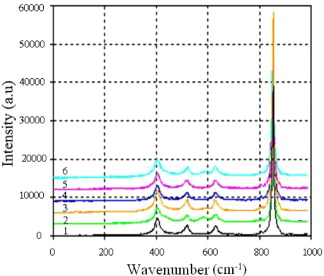
Figure 8. Raman spectra of Fe doped-TiO2 catalysts with different contents of Fe2O3: (1) 025Fe–Ti; (2) 050 Fe–Ti; (3) 100 Fe–Ti; (4) 500 Fe–Ti; (5) 1000 Fe–Ti; (6) 2000 Fe–Ti.
Download figure:
Standard image High-resolution imageThe particle size values of the catalysts were calculated using Scherrer's equation. The figures in table 4 show that the influence of iron oxide content on the ratio of anatase/rutile phases is not simple. In the range from 0.05 to 0.1 mol% of Fe2O3 the percentage of the rutile phase increases from 24.1 to 41%, but at higher values of iron oxide content the proportion of rutile to anatase phase in the studied samples decreased regularly and reached the quantity of 18.2 mol%, close to that in the commercial TiO2 P25. Also, iron oxide content influences the particle size and, as a rule, the specific surface area of the catalyst samples. Although the trend is not very clear, the common understanding is that the particle size should decrease with the content of iron oxide, while the values of surface area varied in the opposite direction.
Table 4. Characteristics of the obtained catalysts.
| Catalyst characteristics | Catalysts | ||||||
|---|---|---|---|---|---|---|---|
| Ti | 025Fe–Ti | 050Fe–Ti | 100Fe–Ti | 500Fe–Ti | 1000Fe–Ti | 2000Fe–Ti | |
| Fe2O3, (mol%) | 0 | 0.025 | 0.05 | 0.10 | 0.50 | 1.00 | 2.00 |
| A, (mol%) | 93.2 | 75.9 | 58.3 | 58.9 | 81.0 | 80.4 | 81.8 |
| R, (mol%) | 6.8 | 24.1 | 40.8 | 41.1 | 19.0 | 19.6 | 18.2 |
| d, (nm) | 30.0 | 27.6 | 29.5 | 30.3 | 24.8 | 21.6 | 19.5 |
| SBET, (m2 g−1) | 45.0 | 15.5 | 11.2 | 9.6 | 34.6 | 36.9 | 42.9 |
| λmax, (nm) | 387 | 425 | 424 | 423 | 442 | 449 | 464 |
| EG, (eV) | 3.20 | 2.92 | 2.93 | 2.93 | 2.80 | 2.76 | 2.67 |
The FE-SEM image (figure 9) of the 025Fe–Ti catalyst sample shows uniform particle size, but in the range from 0.05 to 1.0 mol% of iron oxide content the images characterize a mixture of fine particles and bulk TiO2. In contrast, the image of sample 2000Fe–Ti shows very fine and uniform particles of TiO2 crystals.
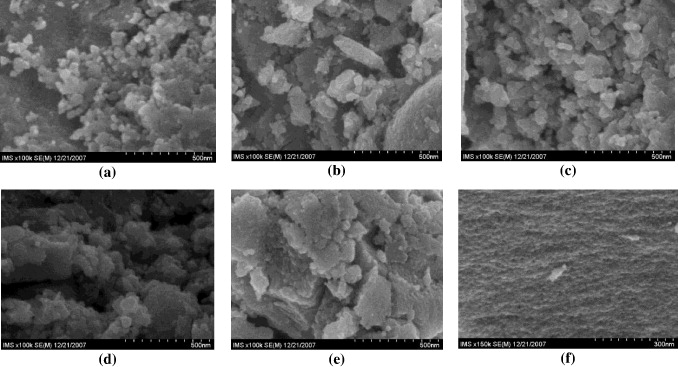
Figure 9. FE-SEM images of Fe-doped TiO2 catalysts. (a) 025Fe–Ti, (b) 050Fe–Ti, (c) 100Fe–Ti, (d) 500Fe–Ti, (e) 1000Fe–Ti, (f) 2000Fe–Ti.
Download figure:
Standard image High-resolution imageThe pure TiO2 catalyst is characterized by the band gap energy value of anatase TiO2 (EG = 3.20 eV). The UV–Vis spectra of all of the Fe-doped TiO2 catalyst samples (figure 10) show a red shift tendency and this shift depends on the iron content in the lattice. Concomitantly, the increase of iron content in the lattice resulted in a decrease of EG. The 2000Fe–Ti sample expressed the biggest shift: the value of λmax reached 464 nm and the value of EG decreased to 2.63 eV. Also one can observe that the color of the catalyst samples changed from white to yellow with the increase of iron content in the lattice.
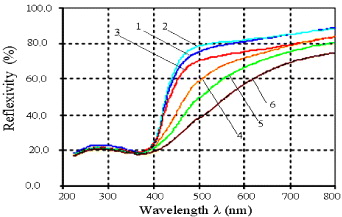
Figure 10. UV–Vis spectra of Fe-doped TiO2 catalysts with different contents of Fe2O3. (1) 025Fe–Ti; (2) 050Fe–Ti; (3) 100Fe–Ti; (4) 500Fe–Ti; (5) 1000Fe–Ti and (6) 2000Fe–Ti.
Download figure:
Standard image High-resolution imageThe IR spectra (figure 11) of all of the Fe-doped TiO2 samples show the characteristic peaks of OH-groups at the surface (3225 cm−1), molecular water (1621 cm−1), Ti–O (653–550 cm−1) and Ti–O–Ti (495–436 cm−1) as in the case of pure TiO2. Nonetheless, it is interesting to note the appearance of a new peak at 2200 cm−1, the absorption intensity of which regularly increases with iron content. The order is as follows: 2000Fe–Ti > 1000Fe–Ti > 500Fe–Ti > 100Fe–Ti > 050Fe–Ti > 025Fe–Ti. It is very probable that this peak could be assigned to the Ti–O–Fe vibration.

Figure 11. IR spectra of Fe-doped TiO2 catalysts with different contents of Fe2O3: (1) 025Fe–Ti; (2) 050Fe–Ti; (3) 100Fe–Ti; (4) 500Fe–Ti; (5) 1000Fe–Ti and (6) 2000Fe–Ti.
Download figure:
Standard image High-resolution image
The results on the catalytic activity of the TiO2 catalysts modified by iron oxide in p-xylene photo-oxidation under UV and visible light irradiation are presented in table 5. From the data in table 5 one can see that in regime 'd', under UV light irradiation, the initial activity and efficiency of pure TiO2 are higher than those of the modified catalysts. Samples 1000Fe–Ti and 2000Fe–Ti expressed the lowest values of efficiency in spite of having the same content of the anatase phase as of pure TiO2 P25. In regime 'e', when the reaction occurred under the visible light of LEDs (λ = 470 nm), the modified catalysts gave higher conversion and yield than the sample of pure TiO2. Obviously, the modification of TiO2 by Fe increased its capacity for light absorption in the long wavelength region, so the modified samples showed an advantage in the visible region of radiation. According to the authors of [21], the superior catalytic activity of the Fe-doped samples is associated with the formation of a ferrioxalate complex. Ferrioxalate is considered as one of the best complexes of Fe3+-containing polycarboxylate. It can absorb orange light and use visible light efficiently. The Fe-Ti catalysts prepared by the flame spray pyrolysis method (FSP) can be regenerated by the oxidation of Fe (II) to Fe (III) under visible light radiation. Yu et al [22] proposed that the reason for the raised photocatalytic activity of TiO2 films doped by Fe3+ is the generation of OH-groups as well as oO atoms.
Table 5. Photocatalytic activity of TiO2 and Fe doped-catalystsa.
| Catalyst | Ti | 025Fe–Ti | 050Fe–Ti | 100Fe–Ti | 500Fe–Ti | 1000Fe–Ti | 2000Fe–Ti | |||||||
|---|---|---|---|---|---|---|---|---|---|---|---|---|---|---|
| UVb | LEDc | UVb | LEDc | UVb | LEDc | UVb | LEDc | UVb | LEDc | UVb | LEDc | UVb | LEDc | |
| Xo d, (%) | 91.7 | 14.3 | 93.3 | 26.3 | 40.6 | 38.7 | 65.5 | 61.5 | 100.0 | 52.1 | 42.4 | 58.7 | 55.0 | 43.3 |
| Y e, (g g−1 catalyst) | 8.10 | 1.88 | 5.59 | 3.62 | 3.48 | 3.72 | 3.02 | 5.88 | 5.34 | 4.29 | 2.74 | 4.09 | 2.52 | 5.64 |
aReaction conditions: under UV and LED irradiation at T = 40 °C; V = 156 × 103 h−1; Coxylen = 19 mg l−1; Coo2 = 300 mg l−1; CoH2O = 11.5 mg l−1. b2 pieces of UV-lamp, λ = 365 nm (total power 24 W); total light intensity 872 lux. c80 pieces of LED, λ = 470 nm (total power 19.2 W); total light intensity 32 lux. dp-xylene conversion. eYield of p-xylene degradation for 60 min.
The results in table 5 show that under visible light irradiation the initial activity of the modified catalysts increased with the content of Fe2O3 and reached a maximum value at 0.1% of the modifier concentration. As the content of Fe2O3 continues to increase to 2.0%, the conversion of p-xylene decreased. The optimum content of Fe2O3 in TiO2 is 0.5% under UV radiation and 0.1% under the visible light radiation of LEDs.
In the decomposition of several organic compounds under visible light radiation, the authors of [23] found the maxima of methanol photo-oxidation at Fe(III) doping levels of 0.25 and 0.5 atom%. The extreme nature of the effect of Fe content is due to several reasons. When replacing Ti(IV) by Fe(III), the created Fe(III) centers should be considered as trapping sites within the TiO2 matrix as well as on the surface of the TiO2 particles [23]. Based on the favorable energy levels, Fe(III) centers may act either as an electron or as a hole trap. The authors of [23] explained the enhancement of conversion efficiency in methanol degradation on Fe(III)-doped titania by assuming that the Fe(III) center acts predominantly as a electron trap from which the electron is transferred to molecular oxygen more rapidly than in the undoped catalyst:

From the reaction kinetics of methanol photo-oxidation on TiO2 it should follow that the catalysis of the O2-reduction by an electron relay would increase the photocatalytic activity.
Wang et al [23] demonstrated that, for methanol photo-oxidation the average number of Fe(III) centers per particle is approximately one. At optimal concentrations, Fe(III) in the particle is sufficient as a shallow electron trap for the optimal catalysis of the O2-reduction. If more than one Fe(III) center is present per particle, a distribution of the catalytic activity will arise from their different positions in the bulk or at the surface of the photocatalyst, respectively. Alternatively some of the Fe(III) dopants might act as hole traps

which leads to an enhanced recombination of the trapped charge carriers by the following reaction:

In addition, the surplus quantity of Fe3+ ions tends to cause the transition of the anatase phase into the rutile one [22]. This fact is another reason for the reduction of catalytic activity. Thus there are several speculative reasons to explain why two catalysts, 2000Fe–Ti and 1000Fe–Ti, with high Fe2O3 contents (1.0 and 2.0% of Fe2O3) have lower activity than the catalysts containing 0.1 and 0.5% of Fe2O3.
The efficiency of the studied catalysts in p-xylene conversion also varies in similar ways to the extent of conversion, but in the case of the 2000Fe-Ti sample, the efficiency is relatively high indicating its good stability under visible light radiation. This fact may be related to the consistency between the physico-chemical properties of the sample (λmax = 464 nm, EG = 2.672 eV) and the radiation energy of the LEDs that facilitate the process in producing electron–hole pairs, leading to the generation of  radicals. Besides, the activity of this catalyst is not very high and the formation of intermediate compounds is relatively weak, so the carbonaceous deposit on the catalyst surface is small, consequently the stability of the catalyst should be improved. The results obtained above suggest the possibility of using combined radiation from UV and LED lighting for improving the efficiency of the catalysts in photocatalytic oxidation. The results of the study of 2000Fe–Ti using different modes of radiation are presented in table 6.
Table 6. Photocatalytic activity of 2000Fe–Ti under different regimes of radiation a.
| Reaction time, (min). | Conversion of p-xylene, Xb, (%) | ||
|---|---|---|---|
| Ic | II d | III e | |
| 1 | 33.2 | 14.4 | 72.7 |
| 5 | 33.0 | 13.3 | 71.9 |
| 30 | 33.1 | 13.8 | 70.4 |
| 60 | 32.8 | 13.2 | 69.3 |
| Y b, (g g−1 catalyst) | 4.72 | 2.08 | 10.50 |
aReaction conditions: under UV and LED radiation at T = 40 °C, V = 312 × 103 h−1, Coxylene = 6.33 mg l−1, CoO2 = 300 mg l−1, CoH2O = 7.83 mg l−1 bYield of p-xylene degradation for 60 min. cTwo pieces of UV-lamp, l =365 nm (total power 24 W); total light intensity 872 lux. dEighty pieces of LED, λ = 470 nm (total power 19.2 W); total light intensity 32 lux. eOne piece of UV-lamp plus 80 pieces of LED; total light intensity 659 lux. fp-xylene conversion.
From the results in table 6 it can be seen that the conversion extents of p-xylene on 2000Fe–Ti under combined radiation (mode III) at every experimental point are higher than under other modes of radiation, although the intensity of the combined radiation (659 lux) is lower than that in mode I (872 lux) about 25%. This may also be explained by the fact that when using UV lamps and LEDs there is a combination of two elements: the strong intensity of UV light and the suitable wavelength emitted by LEDs, at the same time side reactions (creating carbon deposits) should be diminished and the catalyst stability is improved, so that the photocatalytic activity in this mode could be kept stable over 60 minutes. That is why the conversion yield of p-xylene for 60 min on catalyst 2000Fe–Ti under combined lighting (LED + UV) is two times higher than under the UV light radiation and five times higher than under the LED radiation. This result confirms the advantages of the combined mode in the utilization of lighting sources for the reaction of p-xylene oxidation in the gas phase, as well as creates a scientific basis for using sunlight in waste gas treatment.
3.4. Catalytic activities of selected (the best) catalysts
Since the reaction was conducted under different conditions, the activity of the catalysts can only be compared by using the values of the reaction rate. The reaction rate is calculated as follows [24]:

where C0xyl is the initial concentration of p-xylene in the gas mixture, mmol l−1; X is the p-xylene conversion to CO2 and H2O; m is the mass of the catalyst, g and V is the velocity of the flow, l h−1.
The current concentration of the substances is calculated as follows:

with Pj being the partial pressure of the j component, hPa; R = 0.082 l atm mol−1 K−1 = 82 l hPa mol−1 K−1 = 0.082 hPa mol−1 K−1.
Thus the reaction rate in a gradientless system at atmospheric pressure is calculated by the following equation

where P0xyl is the initial partial pressure of p-xylene, hPa. The results of the calculations are shown in table 7.
Table 7. Comparison of activities at 40 °C (including initial reaction rate r) of the best catalysts a.
| Activities | P25 | Ti | 028V-Ti | 025Fe–Ti | 500Fe–Ti | 2000Fe–Ti | |||||
|---|---|---|---|---|---|---|---|---|---|---|---|
| Xo (%) | 100b | 92c | 14d | 62c | 93c | 26d | 100c | 52d | 55c | 43d | 73e |
| r (mmol g−1 h−1) | 47.6b | 262.7c | 40d | 177c | 265.6c | 74.2d | 285.6c | 148.4d | 157.1c | 122.7d | 417e |
| Y (g g−1 catalyst) | 3.8b | 8.1c | 1.88d | 5.4c | 5.59c | 3.62d | 5.34c | 4.29d | 2.52c | 5.64d | 10.5e |
aReaction conditions: Coxyl = 19 mg l−1, Coo2 = 300 mg l−1, CoH2O = 11.5 mg l−1; catalysts were treated at 450 °C. bV = 26 ×103 h−1; three UV lamps of 8 W each; λ = 365 nm; light intensity 1147 lux. c V =156 ×10 h−1; two UV lamps of 8 W each; λ = 365 nm; light intensity 872 lux. dV = 156 ×10 h−1; 80 pieces of LED; λ = 470 nm; total power 19.2 W; total intensity 32 lux. eV = 312 × 10 h−1; one UV lamp of 8 W + 80 pieces of LED; total intensity 659 lux.
The addition of 0.028% V into TiO2 using the sol–gel method (which, as noted above, insignificantly extends the region of light absorption and slightly reduces its particle size while creating samples with low concentrations of OH-groups), makes the catalytic activity of the modified catalysts in p-xylene (conversion extent as well as yield) photo-oxidation lower than that on the pure TiO2 sample.
The effect of TiO2 modification with iron oxide by the same method is very different. In this case the region of light absorption is moved to the visible area (λ = 464 nm) and consequently the value of the band gap energy of the modified catalyst is reduced to 2.67 eV, so that it should be possible to use visible light for the activation of photocatalytic reactions. Under ultraviolet light Fe–Ti catalyst samples with Fe content from 0.025 to 0.500% possesses the same activity as the pure TiO2 sample, but with the content of iron oxide 2.00% the catalyst possesses a lower value of activity compared to the original sample. However, under visible light the catalytic activity of the TiO2 catalysts modified with Fe, expressed as the reaction rate, is higher by 1.85 to 3.7 times compared to that of the pure TiO2; the values of the conversion yield for all of the modified catalysts are also two to three times higher and tend to increase with Fe2O3 content. Certainly this state is associated with the effect of Fe2O3 in extending the region of light absorption towards the longer wavelength zone and narrowing band gap energy, as well as reducing particle size of the modified catalysts. Based on the obtained results, a combined utilization of UV and visible radiation for the activation of catalysts was applied and this experiment has given a very interesting successful result: the activity of the 2000Fe–Ti catalyst rose significantly as can be seen in table 7.
The fact that combined UV + LED lighting increased the activity and stability of catalysts in photo-oxidation opens the possibility for the application of Fe2O3-modified TiO2 as highly active catalysts in exhaust treatments under sunlight. The advantages of thin film catalysts include high efficiency and easy recovery. Catalysts can be recovered by processing in air at 500 °C.
4. Conclusion
Photocatalysts of pure and modified TiO2 with a particle size of about 20–30 nm were prepared using the sol–gel method. Treatment of the TiO2 sample at 450 °C did not lead to considerable changes in its physico-chemical properties and phase composition: the initial activity and stability of the catalyst were the highest when compared with those of catalysts treated at higher temperatures. Modification of the TiO2 samples with vanadium using the sol–gel method reduced the particle size and the number of OH-groups on their surface, therefore the activity of these catalysts should be lower compared to the unmodified sample of TiO2 under ultraviolet radiation. The modification of TiO2 samples with iron in the same way enabled the photon absorption spectrum to move towards the visible band (with λ up to 464 nm) and reduced the value of the band gap energy down to 2.67 eV. Fe-modified catalysts showed advantages over the pure TiO2 sample when operating under visible light radiation. The utilization of UV and visible light in a combined mode of irradiation for the catalyst 2000Fe–Ti increased its activity and degradation efficiency in the p-xylene by up to two to three times with considerable stability. This result creates the possibility of applying this catalytic system in practice under solar light.