
Abstract
In this paper, the synthesis of hydroxyapatite (HAp) nanopowder was studied by chemical precipitation method at different values of reaction temperature, settling time, Ca/P ratio, calcination temperature, (NH4)2HPO4 addition rate, initial concentration of Ca(NO3)2 and (NH4)2HPO4. Analysis results of properties, morphology, structure of HAp powder from infrared (IR) spectra, x-ray diffraction (XRD), energy dispersive x-ray (EDX) spectra and scanning electron microscopy (SEM) indicated that the synthesized HAp powder had cylinder crystal shape with size less than 100 nm, single-phase structure. The variation of the synthesis conditions did not affect the morphology but affected the size of HAp crystals.
Export citation and abstract BibTeX RIS

Content from this work may be used under the terms of the Creative Commons Attribution 3.0 licence. Any further distribution of this work must maintain attribution to the author(s) and the title of the work, journal citation and DOI.
1. Introduction
Hydroxyapatite (HAp) with compositions of stoichiometric Ca10(PO4)6(OH)2 is the main inorganic component of natural bones and teeth (accounts for about 65 wt%, of the bone). It is widely used in the biomedical field because of excellent biocompatibility, high bioactivity, non-toxicity and non-inflammatory behavior and non-immunogenic properties. HAp has rapid bone regeneration ability and creates a direct bond with the host living bone without intermediate connective tissue [1–5]. It is often used in powder form for calcium supplement drug, ceramic and composite form for connecting the bone, orthopedic or repairing bone, coating on metals and alloys for bone splint screw [6–8]. There are many methods to synthesize HAp such as sol–gel, ultrasonic, spray drying, micro-emulsion, mechano-chemistry, hydrothermal and chemical precipitation [9–18]. Some methods require high processing temperature, high raw material cost and complex synthesis process. Chemical precipitation method has advantages which include simple equipment, low cost and ability to obtain nanosized HAp powder with large quantity and high purity. All specific applications of HAp depend on the main characteristics such as Ca/P ratio, crystal size and morphology of HAp [19]. Nano HAp has greater specific surface area, smaller particle size, more uniform distribution than micro HAp, thereby, better resorption and biological activity. Nano HAp promotes the adhesion and proliferation of bone cells and increases the accumulation and the deposition of bone on the surface of the bioceramic material [20]. Therefore, controlling particle size, morphology and phase composition of HAp is very important for biomedical applications.
In this paper we present some results of HAp nanopowder synthesized by chemical precipitation method and the effects of synthetic conditions, i.e. reaction temperature, settling time, Ca/P ratio, calcination temperature, (NH4)2HPO4 addition rate and reactant concentration on morphology, structure and particle size.
2. Experimental
Hydroxyapatite was synthesized by chemical precipitation method using Ca(NO3)2 solution at the various Ca(NO3)2 concentrations 0.25, 0.5, 1 M in water. The (NH4)2HPO4 concentration was varied to obtain the Ca/P molar ratio of 1.5, 1.67 and 3.33. Its solution was added dropwise into Ca(NO3)2 solution with addition rate of 1, 2 and 5 ml min−1. During the process, the pH value of the solution was maintained at 10 by using the concentrated NH3 solution. The reaction was conducted under a stirring rate of 800 rpm at the different temperatures (25, 40, 60 and 80 °C). The obtained precipitate was aged for 2 h followed by settling for 0, 2, 15, 21 and 24 h. The settled precipitate was centrifugally washed at a rate of 4000 rpm, then dried at 80 °C for 24 h, calcined at 400 and 800 °C for 4 h (Nabertherm N20/H, potential 40 V, frequency 50 Hz, power 65 kW, current 14 A) and ground with an agate mortar (2.3 g per 60 min) to obtain white HAp powder.
The characteristic functional groups of HAp were identified by Fourier transform infrared (FTIR) spectroscopy (Nicolet 6700 spectrometer, using KBr pellet technique in the range 4000–400 cm−1, with a resolution of 8 cm−1).
The microstructure of HAp powder was characterized by field emission scanning electron microscopy (FE-SEM) combined with energy-dispersive x-ray spectroscopy (EDX) (S4800 of Hitachi, Japan). The phase purity and crystallinity of the HAp powder were analyzed by x-ray diffraction (XRD) (Siemens D5000 Diffractometer, CuKα radiation (λ = 1.540 56 Å), step angle of 0.030°, scanning rate of 0.042 85° s−1, and 2θ in range of 15–80°. The average crystallite size along c-direction of HAp powder was calculated from (002) reflection in XRD pattern, using Scherrer's equation

where D (nm) is crystallite size, λ (nm) is the wavelength of the x-ray radiation (CuKα), θ (rad) is the diffraction angle and B is the full-width at half-maximum (FWHM) of the peak along (002) direction.
3. Results and discussions
3.1. Effect of reaction temperature
The reaction temperature was an important factor that could affect the morphology, the phase structure and the crystallinity of the synthesized HAp powder. Figure 1 and table 1 show the FTIR spectra and the bonds of the functional groups of the HAp powder synthesized using Ca(NO3)2 and (NH4)2HPO4 solution at the different reaction temperatures. The IR spectra of all synthesized samples showed the characteristic peaks corresponding to HAp. The absorption bands at wave numbers of 1114, 1025, 962.4, 602.2, 570.7 and 469.6 cm−1 were associated with the characteristic of PO43− group, whereas, the bands at 3575 and 633.6 cm−1 were attributed to OH− group. The absorption band at 874 cm−1 was assigned to the P–OH bond. The bands at 3431 and 1637.9 cm−1 correspond to absorbed water. The absorption of water (at 3431 cm−1) was quite strong, indicating the presence of a large amount of water in the product. Besides, the bands of CO32− group at 1461 and 1385.6 cm−1 were barely observed, which indicated no significant presence of CO32− in HAp powder.

Figure 1. IR spectra of HAp powder synthesized at pH 10, (NH4)2HPO4 addition's rate 1 ml min−1, at different temperatures.
Download figure:
Standard image High-resolution imageTable 1. Wave numbers for the functional groups of HAp.
| Functional groups | ν (OH) | ν3 (PO43−) | ν1 (PO43−) | δ (OH) | ν2 (PO43−) | ν4 (PO43−) | ν (HOH) | ν (CO32−) | P – OH |
|---|---|---|---|---|---|---|---|---|---|
| ν (cm−1) [21] | 3572 | 1087 1046 | 962 | 630 | 601 571 | 474 | 1640 | 1450 1420 | 870 |
| ν (cm−1) (experiment) | 3576 | 1113 1032 | 968 | 628 | 602 570 | 463 | 1638 | 1461 1391 | 874 |
The XRD spectra of the HAp powder synthesized at the various temperatures are shown in figure 2. By comparing the XRD patterns of synthesized samples with the standard data in table 2 [22], the characteristic peaks of HAp were identified and there are no characteristic peaks corresponding to calcium carbonate phases or calcium phosphate phases. The strongest peak intensity of the HAp sample at 2θ = 31.74° (corresponding to 2θ = 31.76° of the standard HAp) was of the (211) crystal plane and the other peak at 2θ = 25.85° corresponded to the (002) crystal plane, which were the two most characteristic peaks of HAp. Besides, the other characteristic peaks with less intensity were of the (112) and (300) crystal plane. The results indicated that the synthesized HAp powder had crystalline shape and single phase structure.
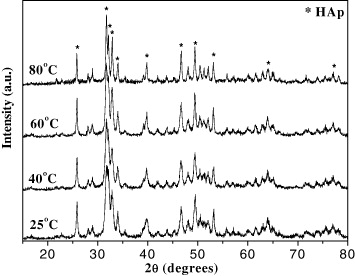
Figure 2. XRD spectra of HAp powder synthesized at pH 10, (NH4)2HPO4 addition's rate 1 ml min−1, at different temperatures.
Download figure:
Standard image High-resolution imageTable 2. The parameters of 2θ, (hkl) and relative intensities of HAp.
| (hkl) | (002) | (211) | (112) | (300) | (202) | (310) | (222) | (213) | (004) | |
|---|---|---|---|---|---|---|---|---|---|---|
| 2θ (°) | 25.85 | 31.76 | 32.16 | 32.89 | 34.03 | 39.80 | 46.69 | 49.45 | 53.14 | |
| NIST 2910a [22] | Relative intensities | 44 | 100 | 59 | 59 | 24 | 21 | 28 | 30 | 15 |
| 2θ (°) | 25.80 | 31.74 | 32.13 | 32.85 | 34.08 | 39.81 | 46.71 | 49.41 | 53.10 | |
| Experimental peak | Relative intensities | 50 | 100 | 73 | 63 | 34 | 34 | 50 | 56 | 34 |
The HAp crystal diameter calculated from the Scherrer equation showed that the crystal diameter increased from 25 to 41 nm on increasing the reaction temperature from 25 to 80 °C (table 3). Increasing the temperature results in faster motion of molecules, so there was an increased chance of their colliding with each other; the HAp particles concentrated to form larger particles. At 25 °C, the HAp particle had the smallest diameter.
Table 3. The crystal diameter of HAp powder synthesized at different temperatures.
| Temperature (°C) | Crystal diameter (nm) |
|---|---|
| 25 | 25 |
| 40 | 27 |
| 60 | 34 |
| 80 | 41 |
Figure 3 and table 4 show the SEM images and average particle size of the HAp powder synthesized at the different temperatures. The synthesized HAp was of cylinder shape, the crystal size increased with increasing temperature, which was in agreement with the x-ray results. The crystal diameter varied from 14 to 35 nm, the crystal length varied from 29 to 94 nm.
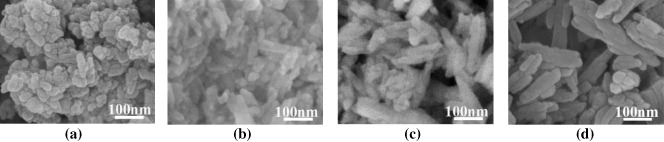
Figure 3. SEM images of HAp powder synthesized at pH = 10, (NH4)2HPO4 addition's rate 1ml/min, various temperatures: (a) 25 °C, (b) 40 °C, (c) 60 °C and (d) 80 °C.
Download figure:
Standard image High-resolution imageTable 4. The average crystal sizes of HAp powder at the various temperatures.
| Temperature (°C) | Average crystal size (nm) |
|---|---|
| 25 | 19 × 29 |
| 40 | 14 × 30 |
| 60 | 35 × 94 |
| 80 | 28 × 80 |
3.2. Effect of settling time
After aging, the HAp suspension was settled in order to stabilize and develop crystals, so it could strongly affect the crystal size.
The IR spectra of HAp samples prepared at 25 °C, pH = 10 with various settling times 0, 2, 15, 21 and 24 h are shown in figure 4. By comparing these IR results with data in table 1, it was found that the obtained HAp had all characteristic peaks of HAp standard.
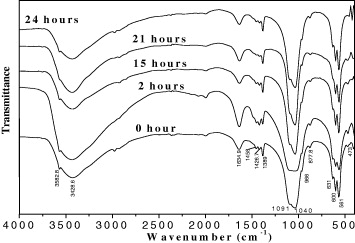
Figure 4. The IR spectra of HAp prepared at 25 °C, pH = 10 with various settling times: 0, 2, 15, 21 and 24 h.
Download figure:
Standard image High-resolution imageThe XRD spectra of HAp powder prepared at different settling times are represented in figure 5. The characteristic diffraction peaks of HAp are indicated. The results showed that HAp synthesized at different settling time had crystal structure, single phase. However, HAp crystal diameter decreases when the settling time increases from 0 to 24 h (table 5), and 15 h is the optimal time so that HAp crystallization process is stabilized after the aging period.

Figure 5. X-ray spectra of HAp prepared at different settling times.
Download figure:
Standard image High-resolution imageTable 5. The crystal diameter of HAp prepared at different settling times.
| Settling time (h) | HAp crystal diameter (nm) |
|---|---|
| 0 | 31 |
| 2 | 25 |
| 15 | 19 |
| 21 | 28 |
| 24 | 21 |
The SEM images of HAp powder prepared at settling times from 0 to 24 h are presented in figure 6. At different settling times, all obtained HAp had a cylinder shape with a reduced size when settling time increased from 0 to 15 h, if settling time increases continuously up to 21 and 24 h, crystal size can increase (table 6). Therefore, the suitable time for crystal stability is 15 h.

Figure 6. SEM images of HAp prepared at different settling times: (a) 0 h, (b) 2 h, (c) 15 h, (d) 21 h, (e) 24 h.
Download figure:
Standard image High-resolution imageTable 6. The average crystal of HAp was calculated from SEM images.
| Settling time (h) | Average crystal size (nm) |
|---|---|
| 0 | 19 × 33 |
| 2 | 19 × 29 |
| 15 | 14 × 36 |
| 21 | 23 × 54 |
| 24 | 22 × 50 |
3.3. Effect of Ca/P ratio
The phase diagram of the system CaO–P2O5–H2O showed that when the Ca/P ratio changed from 3/2 to 10/3, the HAp powder could contain many impurities, depending on reactant excess of (NH4)2HPO4 (ratio of 3/2) or Ca(NO3)2 (ratio of 10/3). The IR spectra of HAp powder synthesized at three Ca/P ratios are shown in figure 7. By comparing these IR results with data in table 1, it was found that the obtained HAp had all the characteristic peaks of HAp. In addition, the XRD results indicated the characteristic diffraction peaks of HAp, and no other phases of calcium phosphate were detected (figure 8). This result is different from those reported in literature. Although the same synthetic route was applied, the detailed procedure was different. In this study, we synthesized HAp powder by dropping slowly (NH4)2HPO4 solution into Ca(NO3)2 solution, so the Ca/P ratio did not affect the purity of the HAp powder, the residual (NH4)2HPO4 or Ca(NO3)2 would be removed by centrifugation. The presence of other phases could only appear when the synthesis process was conducted by dropping simultaneously two solutions of (NH4)2HPO4 and Ca(NO3)2 into the reactor at the given Ca/P ratio. From XRD spectra, at 2θ = 25.85°, according to the Scherrer's equation, the HAp crystal diameter at the Ca/P ratio of 10/6 was 25 nm, smaller than those obtained at two Ca/P ratios of 3/2 and 10/3 (table 7).
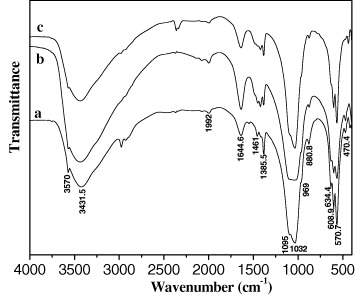
Figure 7. The IR spectra of HAp prepared at 25 °C, pH = 10 using various Ca/P ratios: (a) 3/2; (b) 10/6 and (c) 10/3.
Download figure:
Standard image High-resolution image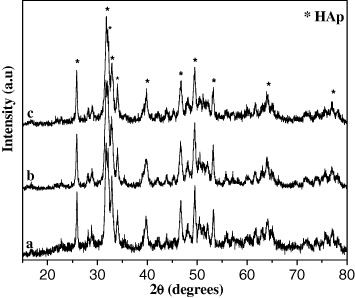
Figure 8. X-ray spectra of HAp samples prepared using various Ca/P ratios: (a) 3/2; (b) 10/6 and (c) 10/3.
Download figure:
Standard image High-resolution imageTable 7. The crystal diameter of HAp synthesized at different Ca/P ratios.
| Ca/P ratios | Crystal diameter (nm) |
|---|---|
| 3/2 | 27 |
| 10/6 | 25 |
| 10/3 | 28 |
Figure 9 presents EDX spectra and table 8 introduces the percentages of the elements in the HAp powder synthesized at three Ca/P ratios: 3/2, 10/3 and 10/6. The characteristic peaks corresponding to Ca, O, P of HAp powder are indicated. In addition, the other peaks corresponding to C and Si were observed due to the CO32− infection in the samples and Si impurities in starting materials.
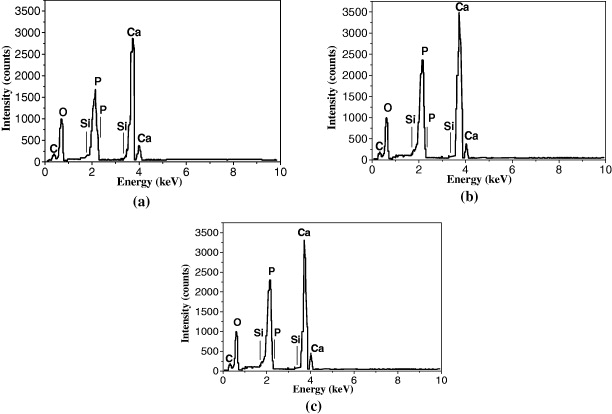
Figure 9. Energy dispersive x-ray spectra of HAp samples synthesized at Ca/P ratios: (a) 3/2; (b) 10/6 and (c) 10/3.
Download figure:
Standard image High-resolution imageTable 8. Elementary analyses in HAp samples.
| Ca/P ratio | Element | C | O | Si | P | Ca |
|---|---|---|---|---|---|---|
| 3/2 | % weight | 3.44 | 44.38 | 0.15 | 16.70 | 35.33 |
| % atom | 6.40 | 61.82 | 0.12 | 12.01 | 19.64 | |
| 10/6 | % weight | 3.88 | 43.76 | 0.23 | 16.54 | 35.59 |
| % atom | 7.20 | 60.90 | 0.18 | 11.89 | 19.83 | |
| 10/3 | % weight | 3.47 | 45.13 | 0.19 | 16.40 | 34.81 |
| % atom | 6.40 | 62.48 | 0.15 | 11.73 | 19.24 |
From the atomic percentages of the elements in HAp samples (table 8), the Ca/P and Ca/P/O ratios could be calculated (table 9). Comparing with theoretical Ca/P/O ratio, it can be estimated that all three samples contained excess oxygen, probably due to the presence of adsorbed CO32− in the HAp powder. The experimental Ca/P ratio value of the HAp synthesized at Ca/P ratio of 10/6 was in good agreement with the theoretical value, indicating the similarity of the obtained HAp powder to natural bone (Ca/P = 1.667). For this reason, the Ca/P ratio in the starting material of 10/6 should be chosen.
Table 9. Ca/P and Ca/P/O ratios in HAp powder: theoretical (T) and experimental (E) values.
| Initial Ca/P ratio | Ca/P (T) | Ca/P (E) | Ca/P/O (T) | Ca/P/O (E) |
|---|---|---|---|---|
| 1.5 | 1.635 | 10/ 6.1/ 31.5 | ||
| 1.67 | 1.67 | 1.667 | 10/ 6/ 26 | 10/ 6/ 30.7 |
| 3.33 | 1.64 | 10/ 6.1/ 32.5 |
The average crystal size of the HAp powder synthesized at various initial Ca/P ratios is presented in figure 10 and table 10.
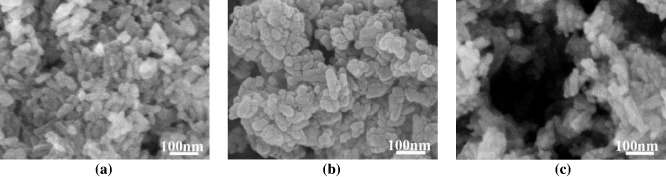
Figure 10. SEM images of HAp powder synthesized at different initial Ca/P ratios: (a) 3/2, (b) 10/6, (c) 10/3.
Download figure:
Standard image High-resolution imageTable 10. SEM based calculated HAp average particle size.
| Ca/P ratio | Average particle size (nm) (diameter × length) |
|---|---|
| 3/2 | 20 × 47 |
| 10/6 | 19 × 29 |
| 10/3 | 21 × 59 |
3.4. Effect of calcination temperature
In order to investigate the effect of treatment temperature, the dried HAp powder samples were heated in air at 400 and 800 °C for 4 h. The IR spectra of HAp samples dried at 80 °C and then heated at 400 and 800 °C are shown in figure 11. The peaks at 1631 and 3425 cm−1 corresponding to the bending vibration of the H–O–H absorbed in the HAp crystals decreased while the other characteristics peaks of HAp were not changed when increasing calcination temperature.
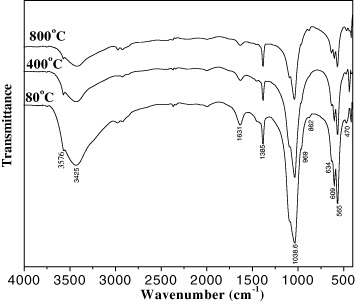
Figure 11. The IR spectra of HAp samples calcined at different temperatures.
Download figure:
Standard image High-resolution imageThe XRD spectra with the characteristic diffraction peaks of HAp confirmed the crystalline shape and single phase purity of the obtained HAp powder (figure 12). Importantly, the amount of CO2 absorbed on the surface of HAp was not significant.
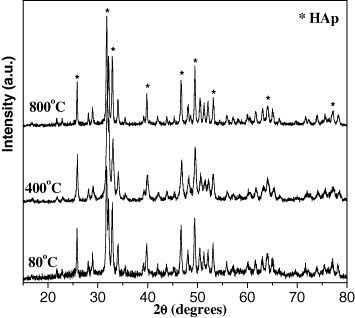
Figure 12. X-ray spectra of HAp samples calcined at different temperatures.
Download figure:
Standard image High-resolution imageThe data in table 11 shows that the crystal size increased with increasing calcination temperature. According to [15], higher heating temperature would lead to an increase in lattice parameters of HAp, so the volume of the hexagon increases and the crystal size changes. In addition, under the effect of temperature, the nanocrystals tend to agglomerate in order to form the larger crystals. Therefore, appropriate calcination temperature is 80 °C.
Table 11. Crystal diameter of HAp heated at different temperatures.
| Calcination temperature (°C) | Crystal diameter of HAp (nm) |
|---|---|
| 80 | 41 |
| 400 | 44 |
| 800 | 50 |
3.5. Effect of (NH4)2HPO4 addition rate
The adding rate of (NH4)2HPO4 affects the morphology, structure and size of formed HAp crystals. Namely, according to well-known collision theory, the larger the (NH4)2HPO4 adding amount, the greater the frequency of reactant collisions, so larger crystals were created. Figure 13 presents the IR spectra of the samples synthesized with the dropping rates of 1, 2 and 5 ml min−1. In general, all IR spectra of the samples have similar shapes and the specific peaks corresponding to functional groups in the HAp molecule.
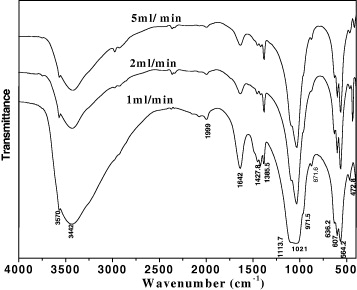
Figure 13. IR spectra of HAp powder synthesized at different (NH4)2HPO4 addition's rates: 1, 2 and 5 ml min−1.
Download figure:
Standard image High-resolution imageFigure 14 and table 12 introduce XRD spectra and XRD-calculated crystal diameters, respectively. In general, XRD patterns of the HAp samples had the same shapes and had only the characteristics peaks of the HAp molecule. From this table, it was found that while (NH4)2HPO4 adding rate increased five times, the crystal diameter did not increase significantly, only from 25 to 27 nm.
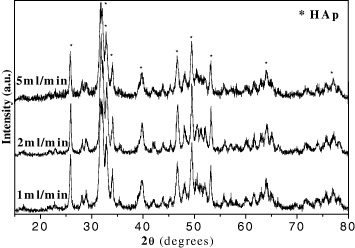
Figure 14. X-ray spectra of HAp powder synthesized at different (NH4)2HPO4 addition's rates: 1, 2 and 5 ml min−1.
Download figure:
Standard image High-resolution imageTable 12. Crystal diameter of HAp synthesized at different (NH4)2HPO4 addition rates.
| (NH4)2HPO4 addition rate (ml min−1) | Crystal diameter of HAp (nm) |
|---|---|
| 1 | 25 |
| 2 | 26 |
| 5 | 27 |
To confirm the XRD results, the morphology of HAp powder was further analyzed by SEM images. Figure 15 and table 13 present the SEM images and SEM-based calculated average crystal sizes. HAp crystal had a cylinder shape with the same diameter of about 19 nm. However, when (NH4)2HPO4 adding rate increased, crystal length increased from 29 to 42 nm. These results allowed to conclude that the increase in (NH4)2HPO4 adding rate could lead to increasing HAp crystal length.
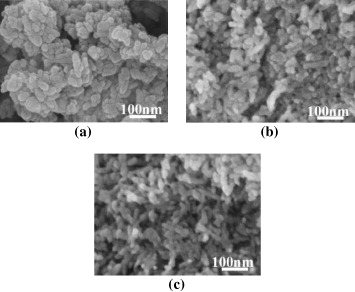
Figure 15. SEM images of HAp samples synthesized at various (NH4)2HPO4 addition rate: (a) 1 ml min−1, (b) 2 ml min−1 and (c) 5 ml min−1.
Download figure:
Standard image High-resolution imageTable 13. Calculated average particle size from SEM images.
| (NH4)2HPO4 addition rate (ml min−1) | Average particle size (nm) |
|---|---|
| 1 | 19 × 29 |
| 2 | 19 × 40 |
| 5 | 19 × 42 |
3.6. Effect of reactant concentration
Figure 16 presents the IR spectra of the HAp powder obtained at various initial concentrations of Ca(NO3)2 solution. It could be found that the IR spectra of the HAp samples had the same shapes and the characteristic peaks of the functional groups of HAp are shown.
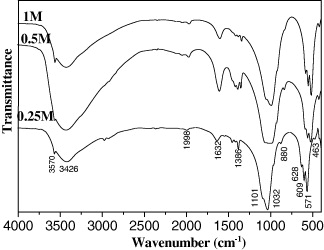
Figure 16. IR spectra of the HAp samples synthesized at different initial concentrations of Ca(NO3)2 solution: 0.25, 0.5 and 1 M.
Download figure:
Standard image High-resolution imageFigure 17 and table 14 demonstrate the XRD spectra and the crystal diameter, respectively, of HAp samples synthesized at different reactant concentrations. From the XRD spectra, it was found that the synthesized HAp had a crystal shape and single phase structure. The crystal diameter was in a range from 19 to 25 nm. XRD analyses also demonstrate a weak effect of reactant concentration (in the above-mentioned range) on the HAp crystal diameter.
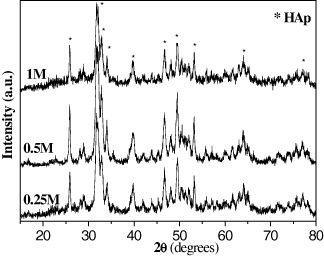
Figure 17. X-ray spectra of the HAp samples synthesized at different initial concentrations of Ca(NO3)2 solution: 0.25, 0.5 and 1 M.
Download figure:
Standard image High-resolution imageTable 14. The crystal diameter of HAp synthesized at various Ca(NO3)2 concentrations.
| Concentration of Ca(NO3)2 (M) | HAp crystal diameter (nm) |
|---|---|
| 0.25 | 19 |
| 0.5 | 25 |
| 1 | 23 |
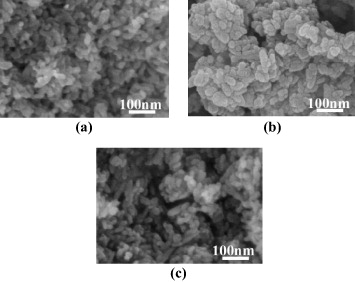
Figure 18 and table 15 show the SEM images and average crystal size of HAp calculated from the SEM images. The reactant concentration had no effect on the morphology of HAp powder. As for the SEM results, it could be found that the HAp crystals had cylinder shape with the crystal diameter varying from 18 to 19 nm and the crystal length varying from 29 to 45 nm.
Figure 18. SEM images of the samples at different initial concentrations of Ca(NO3)2 solution: (a) 0.25 M, (b) 0.5 M and (c) 1 M.
Download figure:
Standard image High-resolution image
Table 15. The average crystal size were calculated from SEM images at different initial concentrations of Ca(NO3)2 solution.
| Concentration of Ca(NO3)2 (M) | Average crystal size (nm) |
|---|---|
| 0.25 | 18 × 31 |
| 0.5 | 19 × 29 |
| 1 | 18 × 45 |
4. Conclusion
HAp powder was synthesized by chemical precipitation method using calcium nitrate, diammonium phosphate solution as reactants, and ammonia as adjusting agent (pH ≈ 10). The obtained results showed that the synthetic conditions were important in controlling the quality, shape and size of the HAp powder. The HAp powders had single-phase crystal structure, cylinder shape with size less than 100 nm, Ca/P ratio of 1.67, corresponding to the ratio in the natural bones and teeth. Although preliminary, these results make HAp powder an interesting alternative for bone replacement and other biomedical applications such as calcium food supplement.
Acknowledgment
Funding of this work was provided by Vietnam Ministry of Science and Technology project (grant No. 49/2012/HD-NDT).