
Abstract
This paper presents our recent research results on synthesis and bioapplications of dye-doped silica-based nanoparticles. The dye-doped water soluble organically modified silicate (ORMOSIL) nanoparticles (NPs) with the size of 15–100 nm were synthesized by modified Stöber method from methyltriethoxysilane CH3Si(OCH3)3 precursor (MTEOS). Because thousands of fluorescent dye molecules are encapsulated in the silica-based matrix, the dye-doped nanoparticles are extremely bright and photostable. Their surfaces were modified with bovine serum albumin (BSA) and biocompatible chemical reagents. The highly intensive luminescent nanoparticles were combined with specific bacterial and breast cancer antigen antibodies. The antibody-conjugated nanoparticles can identify a variety of bacterium, such as Escherichia coli O157:H7, through antibody–antigen interaction and recognition. A highly sensitive breast cancer cell detection has been achieved with the anti-HER2 monoclonal antibody–nanoparticles complex. These results demonstrate the potential to apply these fluorescent nanoparticles in various biodetection systems.
Export citation and abstract BibTeX RIS

Content from this work may be used under the terms of the Creative Commons Attribution 3.0 licence. Any further distribution of this work must maintain attribution to the author(s) and the title of the work, journal citation and DOI.
1. Introduction
The development of nanoprobes has highlighted the prospects of both in vitro and in vivo optical imaging through the development of a variety of multimodal nano probes such as quantum dots [1, 2], upconverting nanophosphors [3], polymeric [4], metallic [5, 6] and magnetic [7] nanoparticles, etc, which declare themselves to be efficient tools for imaging, and also have potential for use in therapeutic applications [8]. However, many of these nanoprobes have long-term toxicity issues that obstruct the progress of their efficiency for long-term use in vivo. Recently, interest has generated in the use of new silica-based nanoparticles for different bioapplications. Silica and organically modified silica (ORMOSIL) nanoparticles have several attributes that facilitate their use as a platform of an ideal nanoprobe [9–11]. The silica-based nanoparticles can be easily synthesized in a cost-effective manner, using microemulsion medium and ambient conditions. These materials are inert, optically transparent, non-antigenic, resistant to bioenvironment and can be conjugated with any fluorophore type, leading to the generation of robust, fluorescent nanoparticles [12,13]. In recent years, ORMOSIL nanoparticles doped with organic dyes have been widely used in many applications such as gene delivery, photodynamic therapy and other photonics areas [12, 14–23]. Actually, ORMOSIL nanoparticles conjugated with a near-infra-red (NIR) fluorophore DY776 and radiolabeled with Iodine−124 were fabricated [11]. The biodistribution demonstrates the use of these NIR dye and Iodine−124 conjugated ORMOSIL nanoparticles as promising probes for safe in vivo bioimaging. These nanoparticles facilitate optical bioimaging in the NIR window, with maximum tissue penetration of light and minimum background signal [24, 25]. The in vivo studies in Drosophila indicate that these novel silica-based nanoparticles are biocompatible and not toxic to whole organisms, and have potential for the development of in vivo and long-term applications [8].
In this paper we present our recent research results on synthesis and bioapplications of dye-doped silica-based nanoparticles. The dye-doped water soluble organically modified silicate (ORMOSIL) nanoparticles (NPs) with the size of 15–100 nm were synthesized by modified Stöber method from methyltriethoxysilane CH3Si(OCH3)3 precursor (MTEOS). Because thousands of fluorescent dye molecules are encapsulated in the silica-based matrix, the dye-doped nanoparticles are extremely bright and photostable. Their surfaces were modified with bovine serum albumin (BSA) and a variety of surface functionalities (hydroxyl/amino/thiol groups). The highly intensive luminescent nanoparticles were combined with specific bacterial and breast cancer antigen antibodies. The antibody-conjugated nanoparticles can identify a variety of bacterium, such as Escherichia coli (E. coli) O157:H7, through antibody–antigen interaction and recognition. A highly sensitive breast cancer cell detection has been achieved with the anti-HER2 monoclonal antibody–nanoparticles complex. These results demonstrate the potential to apply these fluorescent nanoparticles in various biodetection systems.
2. Experimental
2.1. Synthesis
2.1.1. Materials.
Methyltrimethoxysilane (MTEOS), aminopropyl triethoxysilane (APTEOS), dimethylsulfoxide (DMSO), clorotrimethylsilane (CTMES), propanthioltrimethoxysilyl (PTTMEOS), aqueous ammonia (NH4OH) solution 25%, co-surfactant butanol-1 were purchased from Merck. Rhodamine 6G (Rh6G) and rhodamine B (RB) dyes were obtained from exiton. Surfactant aerosol-OT (AOT) (96%) was purchased from Fluka. Dialysis tubing with molecular weight cut-off (MWCO) of 10 000 Da was purchased from Sigma-Aldrich. Bovine serum albumin (BSA) was purchased from Biochem.
2.1.2. Synthesis.
The NPs, both void and dye-doped, were synthesized by modified Stöber method as in the previous works [26, 27]. The functional groups such as amine-NH2, thiol-SH have been incorporated into silicate surfaces using co-hydrolysis of organosilanes with the methyltrimethoxysilicate or propanthioltrimethoxysilyl (figure 1).
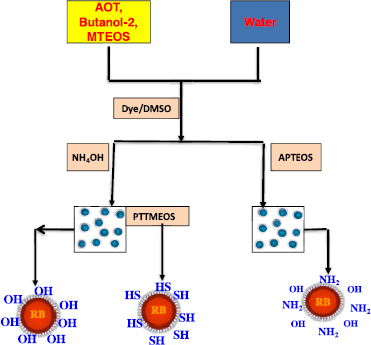
Figure 1. Schema of dye-doped nanoparticles synthesis.
Download figure:
Standard image High-resolution imageThe micelles were prepared by dissolving a fixed amount of AOT and 2-butanone in 20 ml of double-distilled water by vigorous magnetic stirring. The size of ORMOSIL nanoparticles can be controlled by varying the quantity of AOT. An amount of 100 μl of the dye dissolved in DMSO (10 mM) was introduced to the solution with magnetic stir. For void nanoparticles, 100 μl of DMSO without the dye was added. After that, 200 μl of neat MTEOS was added to the micellar system, and the resulting solution was stirred for 30 min. Next, the aminofunctionalized nanoparticles were formed by adding an amount of APTEOS with continuous stir. After 1 h of reaction, a 20 μl of clorotrimethylsilane was added to quench the remaining silanol groups in the surface of NPs. The mixture was then stirred overnight at room temperature. The silanoterminated particles were obtained by replacing APTEOS by an aqueous ammonia solution. By adding the propanthioltrimethoxysilyl (PTTMEOS) precursor in the silanoterminated particles solution and then stirring for 8 h, the thiolfunctionalized nanoparticles were synthesized. The resulting solution hence was dialyzed in a 10 000 Da MWCO dialysis tubing against water for a week in order to remove the remaining chemical agents and all the surfactant AOT and butanol-1. The dialyzed solution then was filtered through a 0.2 μm cut-off membrane filter and kept in the dark at 4 °C. The fabricated DDNPs solution is slightly acidic. These NPs are precipitated in water with pH ∼ 7.
2.1.3. Biofunctionalization by bovine serum albumin (BSA).
An amount of BSA was added into 2-(N-morpholino) ethanesulfonic acid (MES) buffer, stirred for 30 min. Then, the BSA/MES solution was added into amino-hydroxyl-terminated NPs (DDNPs) solution, synthesized by the method as described above, under stirring at 4 °C temperature until optically clear. The mixture solution was kept at 4 °C temperature in the dark for 48 h. The BSA molecules were adsorbed onto the DDNP surface (figure 2).

Figure 2. Scheme of BSA coated ORMOSIL nanoparticles.
Download figure:
Standard image High-resolution imageThe minimum amount of protein BSA required to stabilize DDNPs was determined by employing the fluorescence assay. In this assay, serial dilutions of the BSA–DDNPs (BSA@DDNPs) in MES buffer at pH 6.8 were prepared varying the quantities of BSA from 0 to 1.5 mg in 1 ml of DDNPs solution (mg ml−1) followed by fluorescence spectrophotometric analysis. The minimum amount of protein BSA necessary to cape DDNPs was deduced graphically from the concentration at which the fluorescence intensity at pH 6.8 becomes nearly constant.
2.2. Characterization
Transmission and scanning electron microscopes (TEM, JEM 1011 and SEM, Hitachi S-480) were used to determine the shape, size and surface of particles. The chemical structure of NPs was studied using a micro-Raman spectrograph LAMBRAM-1 with a laser He–Ne 632.8 nm as excitation source at room temperature and an Impact 410 Nicolet Fourier transform infrared (FTIR) spectrophotometer. Absorption spectra were measured using JASCO-V570-UV–Vis–NIR spectrometer. The fluorescence spectra were recorded on a Cary Eclipse spectrofluorometer (Varian).
The fluorescence and anisotropy spectra were measured using Cd–He 442 nm laser as light source and a spectrometer (MicroSpec 2300i Acton Research Corp.) with a cooled CCD camera (Pixis 256 Princeton Instruments) as the detection system. Polarization was acquired with excitation and emission polarizers in vertical–vertical (VV) and vertical–horizontal (VH) configurations. The instrumental correction G-factor was determined with the same configurations.
The two-photon excitation fluorescence lifetime was detected using a Ti–sapphire laser (Mai Tai, Spectra Physics, 900 nm, 80 fs) with a repetition rate reduced to 8 MHz. A time-correlated single-photon counting SPC-430 card (Becker-Hickl GmbH) was used for the acquisition. The monochromator (Jobin-Yvon H10), microchannel plate photomultiplier (Hamamatsu R1564U-06) and an amplifier (Phillips Scientific 6954) were used as the detection system. The microcell (volume 50 μl) was thermostated with a Haake type-F3 circulating bath T = 20 °C.
2.3. Cell labeling
In order to test the biomarker ability of prepared dye-doped nanoparticles (DDNPs), a specific E. coli O157:H7 bacteria and breast cancer cell label was carried out.
2.3.1. E. coli O157:H7 bacteria.
The E. coli O157:H7 bacteria were provided from Institute of Biotechnology (VAST). The direct conjugation of DDNPs to anti E. coli O157:H7 antibodies (Abs) through amine-carboxylic acid coupling were used with N-(3-dimethylaminopropyl)-N'-ethylcarbodiimide hydrochloride (EDC) as catalysator. The DDNP–Ab complex (50 μl) was mixed with bacteria (5 μl, 104 colony-forming unit (CFU) ml−1) while shaking for 10 min at room temperature. The sample was incubated for 30 min at temperature of 37 °C and then centrifuged at 12 000 rpm to remove the excess complex NP–Ab. The pellet was diluted into 100 μl of 0.1 M phosphate buffered saline (PBS) buffer, then was washed twice with 0.1 M PBS and re-suspended in 100 μl of PBS buffer. The control sample (without NPs) was also carried out by the above route.
(a) Cell imaging.
The labeled cells-bacteria were imaged by optical, transmission and scanning electron microscopy. The cell-NP suspensions were imaged on Nikon Ti-E C1Plus inverted confocal microscope using an oil immersion (CFI plan Apo VC 60 × NA 1.4) objective. The fluorescent NPs were excited with the 543 nm line of the green He–Ne (Melles Griot) laser, and emission was detected using a HQ590/50 nm band pass filter.
(b) Cell detection.
The bacterial number in the obtained sample after above incubation procedure was verified by plate counting technique [28]. The obtained sample was divided into two parts. The first half of the sample was grown on agar plate for 16–18 h in a 37 °C incubator to obtain an accurate number of bacterium by CFU counts. The second half of the sample was used for bacterial cell determination by using the spectrofluorometer.
The samples with different bacterial concentration from 104 CFU to 102 CFU were prepared with a step of 25% less concentration than the previous sample: 1 × 10⁴, 7.5 × 10³, 5 × 10³, 2.5 × 10³ CFU and so on. The fluorescence intensity in each sample was detected with 532 nm excitation using a Cary Eclipse spectrofluorometer. Control samples were that of the same bacterial concentrations but without nanoparticles. The fluorescence curves of the controls were considered the background.
2.3.2. Breast cancer cells
(a) Materials.
Humain breast cancer cell line KPL-4 and HeLa cervical cancer cell line were provided by Centre for Cancer Applied Research, College of Science (VNUH). Mouse anti-HER2 monoclonal antibodies (HER2-Abs), Alexa Fluor 488 conjugated goat anti-mouse IgG1, second antibody (M488) and Hoechst 33342 were purchased from Invitrogen. Antibodies HER2 conjugated with Alexa Fluor 546 (AF546) goat anti-mouse conjugated second antibody (HER2@AF546) and Dulbecco's Modified Eagles Medium (DMEM) were obtained from Sigma-Aldrich. Fetal bovine serum (FBS) was purchased from Invitrogen.
(b) DDNPs bioconjugation to HER2- antibody.
HER2-Abs are used in conjugation with DDNPs. Mix DDNPs (100 μl, 4.77 mg ml−1) with antibodies (6.5 μl, 1 mg ml−1) in MES buffer, shake the mix at 200 rpm for 30–60 min keeping 4 °C temperature. After that, the mixture HER2-Ab-modified DDNPs (HER2@DDNPs) were stored at a temperature of 4 °C for 24–48 h before use.
(c) Cell culture.
The cells were cultured in DMEM supplemented with 20% FBS and incubated at 37 °C with 5% CO2.
(d) Immunofluorescence.
There are two types of cell treatment:
- Living cells (3 × 10⁵ CFU) were treated with BSA coated-DDNPs and HER2@DDNPs of 60 nm size (300 μl, 1 μg ml−1) for different period times: 1.5, 3, 6 and 16.5 h at 37 °C. These cells were then fixed with 4% paraformaldehyde fixative and mounting medium (Invitrogen). The nucleus was counterstained with Hoechst 33342.
- Living cells were fixed with mounting medium for 20 min. After that, these cells were incubated with BSA@DDNPs and HER2@DDNPs of 60 nm size for 3 h at 37 °C. Cells were then incubated with M488 and Hoechst 33342.
Fluorescence images were taken using a Zeiss LSM 510 confocal microscope with an oil immersion 40 × objective lens.
(e) Flow cytometry experiments.
The ability of specific recognition of KPL4 cells in the mixing of KPL4 (target) and HeLa cell (negative cells) lines was performed by flow cytometry. Cultured cells were washed in PBS, resuspended in DMEM 10% FBS and kept in the Universal container. The total number of cells was counted using a counting chamber. The HeLa and KPL4 cells were mixed in the ratio 1:1 and 5:1. The aliquots of 1 × 10⁶ cells were transferred to (Fluorescence Activated Cell Sorting) FACS tubes and each tube was stained with BSA@DDNPs, HER2@DDNPs and HER2@AF546, respectively. These were rinsed twice with PBS-1X and samples were redispersed in 100 μl PBS-1X. Flow cytometry analyses were performed in BDFACScan II cytometer by counting 100 000 events.
3. Results and discussion
3.1. Synthesis
3.1.1. Size, shape and chemical structure.
The TEM image of DDNPs is presented in figure 3(a). It shows that the particle shape is spherical with the average diameter of about 80 nm with high monodispersion.

Figure 3. (a) images of synthesized DDNPs; (b) TEM image of DDNPs, (c) Raman spectra of void NPs; curve 1: spectrum of NPs without APTEOS, curve 2: spectrum of NPs prepared with APTEOS. (d) FTIR spectra of NPs; upper curve: spectrum of NPs prepared without APTEOS, lower curve: spectrum of NPs prepared with APTEOS. (e) FTIR spectra of thiolfunctionalized NPs.
Download figure:
Standard image High-resolution imageThe chemical structure of NPs is determined by analyzing the micro-Raman and FTIR spectra of both void ormosil NPs prepared from MTEOS precursor with and without APTEOS catalyzator. As is shown in figures 3(c) and 3(d), the Raman and FTIR spectra of NPs prepared without APTEOS are composed from two principal groups: the vibration bands of SiO2 network and that of methyl group bound to silicon atom (Si–CH3). The Raman and FTIR spectra of NPs prepared with APTEOS are mainly similar to those of non-APTEOS except for the bands of vibration of amino groups NH2. The FTIR spectra of thiolfunctionalized NPs present the vibration bands of thiol groups SH. Therefore, it is clear that the APTEOS catalyst and PTTMTEOS precursor form the amino and thiol groups bound to silicon atom on the surface of NPs. This amino and thiol group will play the role of biocompatible agent in the bioapplications.
3.1.2. Effect of surfactant concentration.
Table 1 shows the effect of surfactant concentration on particle size. As the results show, the particle size increases from 20 nm (sample 2SB20) to 90 nm (sample 6SB20) proportionally to the surfactant quantity. At low surfactant values, the microemulsion droplet size is smaller; the number of MTEOS molecules in the droplet is less. Hence, a smaller number of monomers and nuclei are formed, so the final particle size is smaller. When the surfactant value increases, the microemultion droplet size increases, the MTEOS molecule number in the droplet increases, more monomers and nuclei are formed, and the resultant particles size is larger [29].
Table 1. Characterization of RB dye-doped ORMOSIL nanoparticles with different quantity of surfactant agents.
| Sample | AOT (g) | Bu-2 (μl) | Size (nm) | Concentration of NPs (particles ml−1) | Concentration of RB dye in solution (10–5 mol l−1) | Concentration of RB dye in each nanoparticle (10−2 mol l−1) | Number of dye molecules per particle | Brightnessa |
|---|---|---|---|---|---|---|---|---|
| 2SB20 | 0.22 | 400 | 20 ± 5 | 4.60 × 10¹⁴ | 3.09 | 1.59 | 40 | 35 |
| 4SB20 | 0.44 | 800 | 40 ± 5 | 5.20×10¹³ | 2.43 | 1.39 | 281 | 316 |
| 5.3SB20 | 0.58 | 1060 | 70 ± 5 | 7.84×10¹² | 2.23 | 1.58 | 1710 | 2270 |
| 6SB20 | 0.66 | 1200 | 90± 10 | 3.43×10¹² | 2.24 | 1.72 | 3940 | 5600 |
| RB/ethanol | – | – | 0.5 | – | 1.67 | – | – | 1 |
The particle concentration, dye concentration and number of dye molecules in each nanoparticle were estimated for each sample. The number of dye molecules is ∼40 in 20 nm particles and ∼3940 molecules in 90 nm particles. Therefore, it is clear that each nanoparticle contains from a few tens to thousands of dye molecules depending on their size. The dye concentration in the solution is ∼10−5 M l−1 (figure 4(a), but in each particle this parameter is increased to ∼10−2 M l−1, a very high concentration. The form of absorption spectra of dyes in nanoparticle solution is the same as that of free RB dyes at 1.67 × 10⁻⁵ M l−1 concentration, but with a little shift due to the interactions of dyes with the solid host. There is no effect of dimerization of dyes in nanoparticles, even at ∼10−2 M l−1 concentration (figure 4(b)). At this concentration, the fluorescence of RB molecules in ethanol is totally quenched due to the collision (data not shown), but there is no quenching effect in the fluorescence spectra of nanoparticle solutions (figure 4(c)). These results can be explained as follows: the dye molecules in nanoparticles are located in the pores of silica matrix, so they are monodispersive and there is therefore no collision between them, hence no quenching in their fluorescence.

Figure 4. Absorption and fluorescence spectra of RB molecules in ethanol and in nanoparticles.
Download figure:
Standard image High-resolution imageConsider the fluorescence intensity of one free RB molecule in solution as unity, we can estimate the brightness of each of the nanoparticles from their fluorescence spectra. The results show that the brightness of nanoparticles is much higher than that of free dye molecules (table 1), depending on their size. Approximately 316 times brighter fluorescence was observed from the 40 nm nanoparticles when compared to that obtained from the aqueous dye solution of the same concentration. The fluorescence of one 90 nm ORMOSIL particle is 5600 times brighter than that of one free dye molecule. We can see in table 1 that the brightness of nanoparticles is proportional with the dye number contained in particles, but the brightness of each particle is higher than the dye number inside. As was explained in section 3.2.1, the lifetime of dye molecules in nanoparticles is longer than that in ethanol, e.g. the fluorescence efficiency of dyes in nanoparticles is improved, so their brightness is improved compared with that of free dyes in ethanol.
3.1.3. Effect of precursor concentration.
Table 2 shows the effect of precursor concentration on particle size. As the results show, the particle size increases from 35 nm (sample 5SB40P3) to 80 nm (sample 5SB40P6) proportionally to the precursor quantity.
Table 2. Characterization of RB dye-doped nanoparticles with various quantities of precursor MTEOS.
| Sample | MTEOS (μl) | Size (nm) | Concentration of NPs (particles ml−1) | Concentration of RB dye solution (10−5 mol l−1) | Concentration of RB in each nanoparticle (10−2 mol l−1) | Number of dye molecules per particle | Brightnessa |
|---|---|---|---|---|---|---|---|
| 5SB40P3 | 300 | 35 ± 5 | 6.3 × 10¹³ | 0.82 | 0.44 | 59 | 147 |
| 5SB40P4 | 400 | 42 ± 5 | 3.3×10¹³ | 1.05 | 0.67 | 193 | 390 |
| 5SB40P5 | 500 | 60 ± 5 | 1.6×10¹³ | 1.14 | 0.62 | 424 | 838 |
| 5SB40P6 | 600 | 80 ± 10 | 8.7×10¹² | 1.20 | 0.51 | 829 | 1680 |
| RB /ethanol | – | 0.5 | 1.67 | 1 |
At low precursor values, the number of MTEOS molecules in the droplet is less, so similarly to the case of surfactant concentration, the final particle size is smaller. When the precursor value increases, the MTEOS molecule number in the droplet increases, more monomers and nuclei are formed, and the resultant particle size is larger. Other parameters in table 2 were estimated similarly to the estimation of those in table 1.
3.2. Photophysical properties
3.2.1. Fluorescence spectra and lifetime.
In order to compare the optical properties of the dye doped in NPs and bare dye, the Rh6G and RB dyes were diluted in water with 0.2% DMSO (v/v) such that their intensities of absorption are the same as in NPs. The absorption and fluorescence spectra of RB and Rh6G in water and in NPs are depicted in figure 5. From this figure, the absorption and fluorescence spectra of Rh6G and RB in water and in NPs are similar but a little red shift (∼ 5 nm) of the spectral maxima of dyes in NPs in comparison with those of the dyes in water was observed. This means that the interactions between dye molecules and host matrix are weak.

Figure 5. Absorption and fluorescence spectra of Rh6G (a) and RB (b).
Download figure:
Standard image High-resolution imageFrom figure 6, the lifetime was calculated as 2.3, 2.7 and 3.5 ns for NPs with size 20, 40 and 50 nm, and as 1.5 ns for free dye in ethanol. So it is clear that the fluorescence efficiency of RB dye in the ormosil NPs host is higher than that of free dye in ethanol. This phenomenon can be explained as follows: the dye molecules are located in the ormosil matrix pores, so their monodispersion is improved in comparison with that of free dye in ethanol whose emission efficiency is reduced due to the collision between dye molecules. The dependence of the nanoparticle lifetime on their size will be discussed in a subsequent work.

Figure 6. Fluorescence decays under two photon excitation (Ti:sapphire laser at 900 nm, 80 fs) at room temperature of the RB doped ORMOSIL NPs of different sizes: (1) 20 nm, (2) 40 nm, (3) 50 nm and (4) free RB.
Download figure:
Standard image High-resolution image3.2.2. Anisotropy.
We also measured the polarization anisotropy of R6G in water and in ormosil NPs by using linearly polarized UV light. The polarization anisotropy is defined here as p = (I∥-I⊥)/ (I∥ + I⊥), where I∥ and I⊥ are the fluorescence intensities for polarization components parallel and perpendicular to the alignment direction [30]. The results are presented in figure 7. We can see that R6G in water is not polarized, but R6G in 20 nm ormosil NPs is polarized with a high polarization anisotropy p = 0.18 ± 0.018. For the R6G dye in 60 nm NPs, the polarization is p = 0.07 ± 0.007. Anisotropy of dyes doped in NPs emission is attributable to dye–matrix interactions. Here, it seems to be that particle size might indeed be a major factor influencing emission anisotropy. Other investigation must be done in order to clarity whether the influence of size operates primarily at the level of emission and/or excitation.
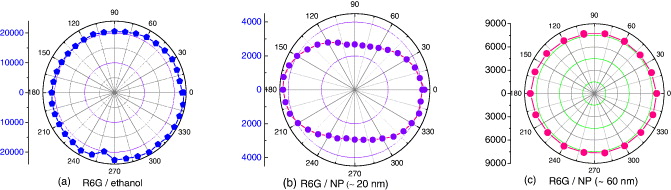
Figure 7. Polarization anisotropy of Rh6G dye in ethanol and doped in ormosil NPs, under linearly polarized UV light.
Download figure:
Standard image High-resolution image3.2.3. Photostability.
Figure 8 shows the fluorescence intensity versus time curves of Rh6G and RB dye molecules in water and in NPs upon a He–Ne laser irradiation at 543 nm and 3.2 mW cm−2. The fluorescence intensity of dyes in water was down to half after about 90 min of irradiation while that of dyes in NPs remains unchanged after 140 min of lighting up.

Figure 8. Emission intensity of Rh6G (a) and RB (b) in water and in NPs versus time. Excitation by He–Ne laser at 543 nm, 3.2 mW cm−2.
Download figure:
Standard image High-resolution imageSpectral conversion of RB-DDNPs was recorded upon irradiation at 325 nm with a power of 400 W cm−2. The spectra show a slight intensity decrease with unchanged full-width at half-maximum (FWHM) in addition to the shift of about 1.5 nm in the peak position (figure 9). The results reveal that DDNPs are rather stable under UV irradiation.

Figure 9. Fluorescence spectra of RB-DDNPs under excitation of He–Cd laser 325 nm.
Download figure:
Standard image High-resolution image3.3. Environment stability
The absorption and fluorescence spectral evolution of the DDNPs was carried out in MES solution with different pH. As shown in figure 10, the absorbance and fluorescence intensities of 40 nm RB-DDNPs were almost unchanged in the range of pH from 6 to 9 and decreased in strong acidic (pH < 6) and basic environments (pH > 9), following a slight red shift of spectral maximum.

Figure 10. Absorption (a) and fluorescence (b) spectra of 40 nm RB DDNPs under different pH.
Download figure:
Standard image High-resolution imageOn the other hand, the free RB dye is a sensitive compound, its chemical structure is easily changed in polarization environment, resulting in the color loss [31]. So, the fluorescence decrease in strong acidic and basic environments may be attributed to the chemical structure changes of dye molecules in pores on the surface of NPs and the aggregation of DDNPs due to the change of their electrostatic diameter 34. The results show the stability of RB dye molecules encapsulated in silica matrix. The prepared DDNPs are suitable and stable in the MES buffer with pH from 6 to 9. For the other environments, it is necessary to overcoat one neutral polymer layer such as polyethylene glycol (PEG), BSA or using other appropriate synthesis routes.
3.4. Biofunctionalization
Figure 11(a) shows the fluorescence spectra of RB–DDNPs (black line) and RB–DD@BSA NPs (red line) at pH 6.4. The fluorescence peak of DDNPs shifts from 580 to 579 nm after the modification of BSA. This shift after conjugation of DDNPs with BSA is attributed to the interactions between dye molecules in pores on the surface of NPs with surrounding BSA molecules. The small shift shows the stability of dye molecules inside of NPs. The inset in figure 11 shows the TEM image of the BSA stabilized RB–DDNPs. As shown above, at pH 3.8 the DDNPs are not stable, their fluorescence spectra are large and have low intensities compared to those at pH 6.4 (figure 11(b)). The added protein BSA forms a capping on NP surface. If the added amount of BSA protein is not enough to overcoat the particles, the fluorescence intensity is still low because of aggregation of particles and color loss, following the dependence of its fluorescence spectra on added BSA amounts (figure 11(b)). When the BSA molecules are enough to cape all the surface of particles to form stable protein-DDNP conjugate, its fluorescence spectral intensity becomes constant. The minimum amount of protein BSA necessary to overcoat the RB–DDNPs was deduced graphically from the concentration at which the fluorescence intensity at pH 3.8 becomes nearly constant. This value must be determined for every DDNPs solution. In this case, the minimum BSA amount necessary for capping is about 800 μg ml−1 (figure 11(b)).

Figure 11. (a) Fluorescence spectra of RB–DDNPs and RB–DD@BSA NPs at pH = 6.4. (b) Fluorescence spectra of RB– DD@BSA NPs versus BSA concentration at pH = 3.8. Inset: TEM image of RB–DD@BSA NPs, scale bar is 500 nm.
Download figure:
Standard image High-resolution image3.5. Cell labeling
3.5.1. E. coli O157:H7 bacteria
(a) Cell imaging.
Figure 12 presents the transmission and fluorescence images of E. coli O157:H7 bacteria after incubation with the DDNP–Ab complex (figures 12(a) and (b)). It is clear from figure 12 that the bacterial cells are labeled by NPs. The bacteria were incubated with antibody specific E. coli O157:H7 do not fluoresce any light (figure 12(c)).
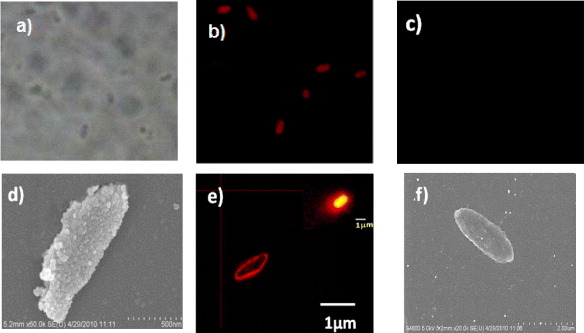
Figure 12. Images of E. coli O157:H7 bacterial cells. Transmission (a) and fluorescence (b) microscope images of cells after incubation with antibody-conjugated nanoparticles and fluorescence microscope image of cells before incubation with antibody-conjugated nanoparticles (c). The size of images is 46 μm × 46 μm. SEM image of cell incubated with DDONP–Ab complex (d). Fluorescence confocal microscope image of bacterial cell after incubation with DDONP–Ab complex (e). The nanoparticle-based fluorescence signal amplification can be easily seen in a fluorescent image ((e) inset). The bacterial size after (d) is much larger than that before (f) incubation, due to the bound nanoparticles.
Download figure:
Standard image High-resolution imageThere are about 300 RB dye molecules encapsulated within each particle (data not shown); high signal amplification was achieved when the antibody-conjugated nanoparticles were bound to antigens on the surface of the bacteria (figures 12(d) and (e)). The SEM image of the E. coli O157:H7 cell after incubation with the DDNP–Ab complex shows that there were thousands of antibody-conjugated nanoparticles bound to a single bacterium, providing significant fluorescent signal amplification as compared with a single dye molecule. The nanoparticle-based signal amplification can be easily seen in a fluorescent image, as shown in figure 12(e) inset. Due to the bound nanoparticles, the dimension of bacterium increased after incubation (figures 12(d) and 12(f)).
(b) Cell detection.
Figure 13 presents the fluorescence curves of samples with different bacterial concentrations. As is shown in figure 12, the fluorescence intensity of samples is proportional to the number of bacteria in the sample. So we can use the curve of fluorescence intensity versus bacterial number as a calibration curve to determine the bacterial number in the sample under analysis [32]. The total time needed for this quantitative analysis is about 3–4 h.
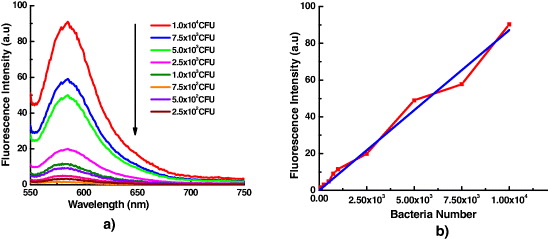
Figure 13. (a) The fluorescence spectra of different bacterial concentration samples; (b) The fluorescence intensity versus the bacterial number—red curve, fit line—blue line.
Download figure:
Standard image High-resolution imageThe fluorescence-based bacterial detection results were compared with those of the plate counting method. The results show the high correlation between two methods (figure 14), confirming the ability of spectrofluorometer method for quantitative bacterial detection. In this experiment, the bacterial detected number is limited at 102 CFU, or the limit of spectrofluorometer method is limited by 102 CFU. The limit of this method will be improved by using the nanoparticles with larger size, which contain thousands of dye molecules in each particle, so this method will be able to detect the single bacterium [32].
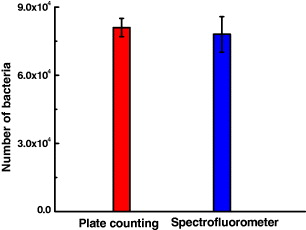
Figure 14. Comparison of bacterial detection with the plate-counting method with the spectrofluorometer method using antibody-conjugated nanoparticles.
Download figure:
Standard image High-resolution image3.5.2. Breast cancer cells
(a) Cell imaging.
Figure 15 shows the fluorescence images of the KPL4 cells and Hela cells treated by DDNPs only (BSA@DDNPs) and DDNPs–HER2 − Ab modified (HER2@DDNPs). It could be clearly seen from the fluorescence imaging that the KPL4 cells labeled with DDNPs emit bright red fluorescence, while all the cellular nuclei stained by DAPI emit blue fluorescence, and DDNPs appeared as bright dots in the membrane and nuclear area of the cells (figure 15(B) lower panel). In contrast, the KPL4 cells treated by DDNPs only and HER2@DDNPs treated Hela cells have quite weak fluorescence images (figures 15(A) and (C) lower panel).
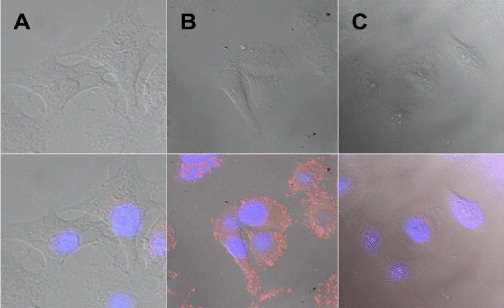
Figure 15. Confocal image of KPL4 living cell treated with (A) BSA@ DDNPs, (B) HER2@DDNPs, (C) Hela cell treated with HER2@DDNPs. The upper panel shows the transmission image and the lower panel shows both the transmission and fluorescence images. Image size: 4.6 μm.
Download figure:
Standard image High-resolution imageFigure 16 presents the fluorescence images of fixed cells treated by HER2@DDNPs. We can see clearly that HER2@DDNPs are concentrated around KPL4 cell membrane. In contrast, HeLa cells incubated with HER2@DDNPs did not express fluorescence either of DDNPs or of M488.

Figure 16. Confocal image of fixed cells treated with HER2@DDNPs. (A) KPL4 cells and (B) Hela cell. Image size: 4.6 μm.
Download figure:
Standard image High-resolution imageAs can be seen in figure 17, the fluorescence image of KPL-4 cells incubated with HER2@DDNPs for 3 h is most abundant due to the highest fluorescence intensity. The fluorescence intensity of cells of 6 and 16.5 h incubation is decreased. This can be explained as follows: after 3 h of incubation with cells, the antibodies had the highest ability to bind to their receptors. For more times of incubation, the endocytosis and phagocytosis may affect the fluorescence expression.

Figure 17. Fluorescence image of KPL4 cells treated with HER2@DDNPs at four different period times: 1.5, 3, 6 and 16.5 h.
Download figure:
Standard image High-resolution image(b) Cell detection.
As shown in figures 18(a) and (b), the signal curves from the NPs incubated with either negative or target cells, but in the absence of antibodies, are almost the same and can be considered as background lines with intensities about 2.5 × 10³. The signal curves of the mixture of HeLa/ KPL4 cells in the ratio 1:1 and 5:1, incubated with HER2@AF546, are similar to the background, having intensity about 3.5 × 10³ and 3.0 × 10³, respectively (figures 18(c) and (d)).

Figure 18. Flow cytometry analyses using BSA@DDNPs, HER2@DDNPs and HER2@AF546. The curves represent: (a) mixture of HeLa and KPL4 cells in the ratio 1:1 only, and incubated with (b) BSA@DDNPs, (c) HER2@AF546 and (e) HER2@DDNPs. Mixture of ratio 5:1 incubated with (d) HER2@AF546 and (f) HER2@DDNPs.
Download figure:
Standard image High-resolution image
This intensity is only slightly higher than that of the background, implying that by using the label AF546, it is difficult to specifically discriminate the KPL4 cells from HeLa cells at those concentration ratios. The fluorescence curves of mixture incubated with HER2@DDNPs have a large enhancement in intensity, about 2 × 10⁴ and 6 × 10³ for the ratios 1:1 and 5:1, respectively. These results show that the KPL4 cells can be specifically detected using the DDNPs markers, even when the percentage of KPL4 cells is five times less than HeLa cells.
4. Conclusion
Aqueous Rh6G and RB doped silica nanoparticles have been synthesized by modified Stöber method. The nanoparticles are uniform highly mono-dispersed spheres with diameters in the range of 20–90 nm. The surface of dye-doped nanoparticles has been functionalized with different biocompatible chemical groups like amino, hydroxyl and thiol. Their surface was also modified by BSA as a biocompatible layer. The photophysical properties of the dyes inside nanoparticles such as photostability, brightness, lifetime and bioenvironmental stability are improved in comparison with those of bare dyes in water. The number of dye molecules is ∼3940 molecules in 90 nm particles with brightness about 5600 times higher than that of free dye due to the improvement of lifetime of dyes encapsulated in nanoparticles. The dye-doped silica-based nanoparticles were used for immunolabeling the bacteria E. coli O157:H7 and breast cancer cells. The results show that due to the brightness of nanoparticles, the fluorescence microscope signal of bacteria is amplified. A spectrofluorometer method for rapid quantitative detection of bacteria was proposed. The breast cancer cells labeled by anti-HER2 monoclonal antibody–nanoparticles complex were efficiently optically imaged and detected with much higher sensibility than those labeled by antibody-free dyes. The dye-doped silica-based nanoparticles show their ability to work as markers for different bioapplications.
Acknowledgment
This work was supported by National Program of Fundamental Research (NAFOSTED) no. 103.06.101.09