
Abstract
Metallic powder has applications in many fields. In applications for preservation and anti-oxidation, iron powder has been used as an air oxygen reducer which is capable of decreasing microclimatic oxygen concentrations in a hermetic mini-environment. In this role, if we increase the specific surface area by reducing the particle size of the iron powder, the rate and performance of oxygen reduction will be improved significantly. In addition, the porosity of iron powder also contributes considerably. The iron powder can be fabricated using many methods: chemical deposition, powder metallurgy and mechanical milling. The technique of milling has certain advantages, especially for the formation of technical iron powder. The experimental equipment used was a Fritsch P-6 planetary ball mill. The iron powder was prepared with different milling times, from 1 up to 30 h in acetone as a protective environment. The powder products obtained were analyzed using field emission scanning electron microscope (FE-SEM), energy dispersive x-ray (EDX), x-ray diffraction (XRD), dynamic laser scattering (DLS), Brunauer–Emmett–Teller (BET) techniques and also magnetic characterization by vibrating sample magnetometer (VSM). The results show a correlation between the milling time and the crystallite and particle size, specific surface area, magnetic properties and nanoscale porosity of the iron powder. The iron powders obtained were a kind of mesoporous materials. The properties of the iron powder were examined with respect to their oxygen reducing kinetics.
Export citation and abstract BibTeX RIS

Content from this work may be used under the terms of the Creative Commons Attribution 3.0 licence. Any further distribution of this work must maintain attribution to the author(s) and the title of the work, journal citation and DOI.
1. Introduction
Metal powders have been used in many fields and have an important role in equipment manufacture using sintering techniques [1, 2]. In addition, some active metal powders such as zinc and iron powders, being easily oxidized in natural atmosphere, have been also used as air oxygen reducers decreasing air oxygen concentrations in a hermetic mini-environment for anti-oxidation preservation [3, 4].
Among metal powders, iron powder has been the most manufactured and used. Nanoscale iron particles represent a new generation of environmental remediation technologies that could provide cost-effective solutions to some of the most challenging environmental cleanup problems. Nanoscale iron particles have large surface areas and high surface reactivity. Equally important, they provide enormous flexibility for in situ applications. Research has shown that nanoscale iron particles are very effective for the transformation and detoxification of a wide variety of common environmental contaminants, such as chlorinated organic solvents, organochlorine pesticides and polychlorinated biphenyls (PCBs). Modified iron nanoparticles, such as catalyzed and supported nanoparticles have been synthesized to further enhance the speed and efficiency of remediation [5].
There are many methods to manufacture of iron powder, such as mechanical grinding, spraying the molten metal under high pressure into a rapidly cooled environment, reconstituting oxide powders using CO, pyrolysis of metallic carbonyl compounds, electrochemical deposition, etc. The technique of mechanical grinding has been considered as it possesses certain advantages, especially for manufacturing a technical iron powder.
High-energy milling method has usually been used to fabricate powder materials with a few tens of nanometers in size. The material milling is based on the impact of the hard steel balls which rotate in a closed chamber with a very high speed. A sealed chamber containing materials for milling can be kept in a high vacuum condition or filled by a noble gas or liquid as a protective environment. The milling with balls made from hard alloy steel or hard materials such as tungsten carbide breaks and crushes the materials into powder of small size in a few nanometers. The powder particles trapped between the balls were crushed and generated a large number of crystal defects: dislocations, holes, deformation network and increased number of grain boundaries. The balls collision also causes a rupture and a cold cohesion of the powder particles, generating separate surfaces of grain boundaries at the atomic scale. The fracturing process increases the number of the interfaces and reduces the particle size from millimeters to nanometers [6].
In the same of conditions and sample milling mode, the milling time is crucial to the nature of the powder products. On the other hand, the milling time is directly related to energy use as well as the purity of the obtained powder products.
This paper presents the results of investigation on some typical properties of nanocrystalline iron powders prepared by milling techniques using a Fritsch P-6 planetary ball miller.
2. Experimental
The Fritsch P-6 planetary ball miller has four milling stations in which a few hundred grams of the powder can be milled at a time. The planetary ball miller owes its name to the planet-like movement of its vials which are arranged on a rotating support disc and a special drive mechanism rotating around their own axes. The centrifugal force is produced by the vials rotating around their own axes and by the rotating support disc, both impact on the vial filled with material to be ground and the grinding balls. The vials and the supporting disc rotate in opposite directions, causing the grinding balls to move in a complex manner and impact on the milled materials from different sides.
Grinding vials and balls can be fabricated from eight different materials—agate, silicon nitride, sintered corundum, zirconia, chrome steel, Cr–Ni steel, tungsten carbide and plastic polyamide [7]. Vials and grinding balls used in this study were fabricated from tungsten carbide.
The milling process of manufacturing iron powder is described in scheme

Scheme 1. Steps in the mechanical grinding process to prepare fine iron powders.
Download figure:
Standard image High-resolution imageStudied iron powder samples are listed in table 1, in which the sample N0 is the initial material. The composition and structure of the samples were examined on the XRD, model SIEMENS D5000; surface morphology and chemical composition were determined by FE-SEM and EDX, model FESEM S-4800. Particle size distribution was determined by DLS on the HORIBA LA-950 equipment. The specific surface area and the pore size distribution were determined using the method of isothermal adsorption of nitrogen on the ASAP 2020 V3.01H. Several magnetic properties of milled iron powder such as saturation Ms and coercivity Hc were determined using the magnetization curves M(H) [9] measured by VSM, DMS 880 model at room temperature.
Table 1. Symbol and input parameters for the Fritsch P-6 planetary ball mill, milling mode P6.1.
| Sample | N0 | N1 | N2 | N3 | N4 | N5 | N6 |
|---|---|---|---|---|---|---|---|
| Weight (g batch−1vial−1) | 15.01 | 15.02 | 15.02 | 15.01 | 15.02 | 15.01 | 15.02 |
| Milling time (h) | 0 | 1 | 2 | 5 | 10 | 20 | 30 |
The crystallite size was calculated from the XRD pattern using the Scherrer's equation [10]

where Dcrys is crystal size (nm), θ is peak angle, λ is the x-ray radiation wavelength (λ = 0.154 056 nm for Cu-Kα cathode), β is the width of the XRD peak at half height (radian) and k is a shape factor (about 0.89 for magnetite and maghemite). 2θ = 44.67° is the position of the maximum diffraction peak corresponding to the (110) plane.
The particle sizes of the powders (DBET) were determined using the Brunauer–Emmett–Teller (BET) method and equation [11]

where ρ is the density (g m−3) and Ss is the specific surface area of the iron powders (m2 g−1).
3. Results and discussion
3.1. The composition and crystal structure
Raw materials and grinding products were analyzed to determine their components (iron metal/iron oxides) by EDX analysis. The results showed that with milling time of the range from 1 to 30 h, the products' purity (iron metal) is very high, up to 97%.
Table 2 presents obtained results of the analysis, N0 sample—without milling, N6 sample—30 h of milling. The average values of the percentage by weight show an increase of the impurity (iron oxides) component, but it is very small. A total purity difference of N6 sample compared to the original sample N0 was only 0.70% in mass, which means there was nearly no oxidation occurring during the preparing process.
Table 2. Chemical components of N0 and N6 sample, achieved from EDX results.
| Element | O (wt%) | Fe (wt%) | Total (wt%) | |||
|---|---|---|---|---|---|---|
| N0 | N6 | N0 | N6 | N0 | N6 | |
| 1 | 1.91 | 3.12 | 98.09 | 96.88 | 100 | 100 |
| 2 | 2.41 | 2.90 | 97.59 | 97.10 | 100 | 100 |
| 3 | 2.59 | 2.98 | 97.41 | 97.02 | 100 | 100 |
The EDX spectra of the N0 and N6 samples are shown in figure 1(a) (without milling) and 1(b) (30 h milling). This result shows that there is no change between the EDX spectra even through increasing milling time up to 30 h. The grinding process, as well as the processing and storage of the product did not generate any new peak in the EDX spectrum, in comparison with raw materials; in particular, the percentage of oxygen is nearly not increased.

Figure 1. The EDX spectra of the iron powder: (a) without milling and (b) after 30 h milling.
Download figure:
Standard image High-resolution imageThe observation results obtained by FE-SEM showed that in the early stages of the milling process, the ion powder particles were flattened to form thin plates with small thickness, but their surface areas were large (figure 2(b)). When the milling time was less than 5 h, the particles reached sizes of a few tens of micrometers.

Figure 2. Morphology of samples: N0 (a), N1 (b).
Download figure:
Standard image High-resolution imageWhen the milling time was increased to more than 5 h, the observation on FE-SEM image shows the presence of a significant amount of individual particles 50–85 nm in size (figure 3(a)), but they mostly linked to form particle clusters a few micrometers in size (figure 3(b)). While the milling time was continuously increased to 10 h and more, the results of measuring the size distribution by DLS technique show that the average sizes of the clusters decreases significantly, as shown in figure 8(a).

Figure 3. Morphology of iron powder N4: individual particles (a), clusters (b) of iron powder.
Download figure:
Standard image High-resolution imageWhen milling time was increased from 1 to 30 h, the XRD diagram, with angle 2θ values in the range from 20° to 100° of all samples from N0 to N6 have four characteristic diffraction peaks of crystalline iron of BCC α-Fe structure. However, the width of the peaks tended to be broader, and the peak intensity decreased with increasing milling time, and small amounts of debris appeared on the peaks. An x-ray diffraction diagram of the N1, N3, N5 and N6 samples is shown in figure 4(a).

Figure 4. X-ray diffraction patterns of samples: (a) N1, N3, N5, N6 and (b) N0–N6: two peaks at 2θ = 44.67° and 82.32° corresponding to the planes (110) and (211).
Download figure:
Standard image High-resolution imageBased on equation (1), the crystalline size Dcrys of iron powders was determined as a function of the milling time, as shown in figure 5. In the early stages of the milling process, the crystalline size decreased, however, with increasing milling time more than 5 h, the size also decreased but very slowly (figure 5). From this it can be understood that the balls' impact on the small particles decreased strongly in comparison with that on big particles, and the long milling time would approach the critical parameter of the machine.

Figure 5. Effect of milling time on the crystal size of iron powder.
Download figure:
Standard image High-resolution imageX-ray diffraction diagrams (figure 6) did not show any new phase which suggests that this milling process is effective at protecting the metal iron powder from oxidation. This result was entirely consistent with published data [12, 13].

Figure 6. The particle size distribution curves of samples N3–N6 determined by DLS technique.
Download figure:
Standard image High-resolution image3.2. The particle size distribution
The particle size distributions of the samples N1–N6 and the original iron powder N0 sample (raw materials) were analysed by DLS technique. The results show a very strong shift of the particle size distribution curves as a function of milling time, and especially the peaks become narrower (figure 6). The results also show that the particle size of sample N0 is in the range of 30 − 400 μm, but those of samples N4–N6 are only in the range of 1–30 μm, meaning that the width of peaks becomes about ten times smaller (figure 6).
Based on the particle size distribution, the average sizes of particle DDLS were determined. The specific surface area Ss of product iron powder was determined using isothermal nitrogen adsorption method. The plots of average size DDLS and Ss area versus milling time are shown in figure 7 (curves a and c). When milling times increased up to 30 h, DDLS reduced from 160.77 down to 7.21 μm, and the specific surface area increased from approximately 1 to 7 m2 g−1.

Figure 7. Effect of milling time on: (a) average particle size (DDLS); (b) the non-linear fitting curves; (c) specific surface area (Ss) of iron powder.
Download figure:
Standard image High-resolution imageIt is empirically found that the average particle size depends on milling time according to equation

where DDLS is the average size (μm), t is the milling time (h). Correlation coefficient of the empirical equation (3) is vey high, reaching 0.999.
The obtained empirical equation describes well the general decline of particle size as a function of milling time, in the range of 1–30 h (curves a and b in figure 7).
Extrapolating the milling time up to 100 h, the obtained product should reach an average particle size DDLS = 3.76 μm. According to the FE-SEM observation there are iron nanoparticles. But results of DLS technique show the average size in micrometers, meaning the size of particle clusters. These clusters can also be practically observed in the FE-SEM images (figure 3).
The value of the maximum distribution Pmax and particle size DPmax at the maximum distribution of the iron powders took a strong variation in the first 5 h of milling, then the variation of these parameters slowly decreased (figure 8). The results indicate that the range of 1–5 h is the period of milling for the strongest particle size reduction. After the first 5 h of milling, the average particle size of the powder products reduced from 160 down to 25 μm and after 10 h of milling time, the size dropped below 10 μm.

Figure 8. Effect of milling time on (a) the largest distribution (Pmax); (b) the particle size at the largest distribution (DPmax) of the samples.
Download figure:
Standard image High-resolution imageWhile the milling times increased above 5 h, average particle sizes changed slightly, but the specific surface area continuously increased (curve c in figure 7). These results supported that the images of the nanoparticles and the clusters including the other nanoparticles were very reliably observed by FE-SEM (figure 3). Therefore, it can be confirmed that the particle sizes measured by DLS were the size of the independent clusters.
3.3. Specific surface and porosity
For the sample with 5 h of milling, the Spore/Ss ratio changes slightly and takes a value of about 10–20%, which means that the surface of porosity contributes about 10–20% of the total specific surface area of the powder, while the specific surface area continues to increase strongly with increasing milling time (figure 9). Therefore, it is demonstrated that an amount of new particles is continuously generated when milling time is increased up to 20 h. But, after 20 h of milling, the specific surface area and average micropore diameters have a little variation, at this time the maximum distribution Pmax increased, which means that more and more uniform particle sizes of product powders were formed. Thus, it can be seen that the first stage of the grinding process produces the greatest deformation of the raw material with cracks appearing due to the mechanical effect of the mill balls and the particles' own many corners and edges.

Figure 9. Effect of milling time on specific surface area (Ss), Spore to Ss ratio of the iron powder (Spore/Ss)
Download figure:
Standard image High-resolution imageWith increasing specific surface area from 1.2 to 7.3 m2 g−1, the average diameter of micropores also increases from 15 to 70 nm. This result shows that the obtained iron powder is of mesoporous materials.
The dependence of the porosity on milling time is shown in figure 10. After 1 h of milling, average micropore diameters increased strongly in comparison with raw materials. However, when the milling time continues increasing, the diameters tend to decrease. This means the micropores' specific surface area slightly depends on the milling time, even up to 30 h. With 5 h of milling, flat particles are created (see figure 2(b)) because of the plastic deformation. Then they are broken up to increase the number of grains, and porosity increases providing the strong increase of micropores' specific surface area, thus the total specific surface area consequently increases (figure 9).

Figure 10. Effect of milling time on average micropore diameters (Dpore) and specific micropores volume (Vpore).
Download figure:
Standard image High-resolution imageCorrelation between the milling time and particle size is described according to equation (3). Therefore, it can be said that particle size reduction process is stable and balanced with the process of recombination between nanoparticles together to form clusters after 20 h of milling, as mentioned above.
The particle sizes of N3–N6 samples are at nanometer scale, and thus sizes DBET are determined by BET method using specific surface area Ss based on equation (2). The results show that DBET decreased, and specific surface area Ss evidently increased, shown in figure 11.
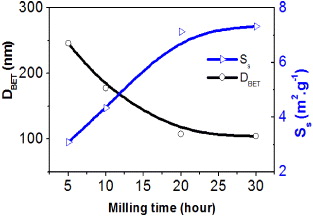
Figure 11. Effect of milling time on average particle size (DBET) and specific surface area (Ss).
Download figure:
Standard image High-resolution imageThe general results of the study are listed in table 3 which shows the main characteristics of the milled iron powder samples for different milling times.
Table 3. Summary of results of analysis of the typical properties of the iron powder samples.
| Sample | N0 | N1 | N2 | N3 | N4 | N5 | N6 |
|---|---|---|---|---|---|---|---|
| Purity (wt%) | 97.70 | 97.49 | 97.36 | 97.21 | 97.10 | 97.02 | 97.00 |
| Average cluster size DDLS (μm) | 160.77 | 90.86 | 64.07 | 26.05 | 11.69 | 8.89 | 7.23 |
| BET particle size DBET (nm) | – | – | – | 245.81 | 177.21 | 107.32 | 104.38 |
| Crystal size Dcrys (nm) | 40.37 | 26.07 | 22.62 | 16.06 | 9.79 | 9.09 | 8.25 |
| Specific surface area Ss (m2 g−1) | 1.2 | 2.1 | 2.9 | 3.1 | 4.3 | 7.1 | 7.3 |
| Average micropore diameter Dpore (nm) | 29 | 69 | 40 | 33 | 32 | 17 | 18 |
| Saturation magnetization Ms (emu g−1) | 206.83 | 200.52 | 194.22 | 188.89 | 178.44 | 154.22 | 145.98 |
| Coercivity Hc (Oe) | 35.18 | 40.33 | 50.01 | 49.57 | – | 57.87 | 61.57 |
3.4. Magnetic properties
The magnetization curves M(H) were measured at room temperature using VSM type DMS 880, with the applied external field H from −11 to +11 kOe. The growth rate of H in each step was 180 Oe in staying 3 s, but in the range of −500 to +500 Oe, the step was 100 Oe. All of the iron powder samples before and after milling provided the same type of characteristic magnetization curves, as shown in figure 12.

Figure 12. The magnetization curves M(H) of samples N1, N4 and N6.
Download figure:
Standard image High-resolution imageThe parameters such as saturation magnetization Ms and coercivity Hc were determined from the magnetization curves M(H). The results were summarized in table 3.
The form of equation describing the ground products saturation magnetization was established by linear fitting experimental data, figure 13:

where Ms is the saturation magnetization (emu g−1), t is the milling time (h). Linear fitting correlation coefficient R of relation between Ms and t is relatively high, R = 0.981. This is a testament to the high linearity and reliability of the results.

Figure 13. Effect of milling time on saturation magnetization (Ms) of the iron powder samples.
Download figure:
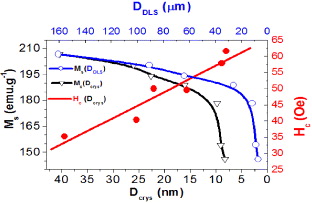
Standard image High-resolution imageFigure 14 shows the dependence of saturation magnetization (Ms) on the crystal size (Dcrys) and the average cluster size (DDLS) of the iron powder samples. Accordingly, when the milling time was increased, these sizes and Ms decreased. At the first stage of the milling process, reduction of Ms was smaller than the reduction of the particle sizes.
Figure 14. The variation of saturation magnetization corresponding to the average cluster size (Ms(DDLS)), crystallite size Ms(Dcrys) and Hc(Dcrys).
Download figure:
Standard image High-resolution image
After 5 h of milling, the particle size decreased slowly but conversely Ms decreased rapidly; especially Ms decreased strongly depending on DDLS (figure 14). The decrease of Ms can be caused by the effect of decrease of particle size and surface energy consumption during the milling process. There was a formation of amorphous phase on the surface of the iron powder particles, because the intensity of diffraction peaks in XRD schema decreased with increasing milling time. On the other hand, the intensity of peaks and Ms increased again approximately back to the original value, after incubating at 350 °C for 2 h in an argon atmosphere. It can be considered as a form of clusters.
In conclusion, in addition to observing by FE-SEM, x-ray diffraction spectrum and the changes of specific surface area, the variations of the saturation magnetization gives us evidence of forming nanoparticles of iron metal powder after 5 h milling.
The relationship between the variation of coercivity of the powder product and crystal size is also shown in figure 14 (line Hc (Dcrys)). The results showed that Hc increased when Dcrys decreased, corresponding to the increase of milling time. Iron is a kind of soft magnetic material which has a weak anisotropy; coercivity is proportional to the anisotropy of the crystal [14]. The increase of Hc corresponding to decrease of Ms is caused by the anisotropy and the structural changes. The variations of Hc and Ms are strongly influenced by the grain structure of materials. The coercivity is strongly dominated by the crystal anisotropy.
When the particle size of ferromagnetic materials is large (larger than domain wall sizes), the magnetization process and magnetic reversal are often affected by the pinning process of moving wall domain because of grain boundaries, so the coercivity will be inversely proportional to particle size, corresponding to the early stages of the milling process. When grinding times increase up to 5 h, particles sizes of iron powders obtained are fine (nano-structure), the particles sizes are smaller than the ferromagnetic exchange interaction length, anisotropic crystal is averaged, and the coercivity continuously changes [15].
To show the dependence of the variation in grinding products' coercivity on the crystal size, correlation function between Hc and Dcrys was fitted with the experimental data. The fitting obtained was a linear function as follows:

where Hc was the coercivity of milled powder product (Oe), Dcrys was the crystal size (nm). Linear fitting correlation coefficient R1 of relation between Hc and Dcrys was high, reaching R1 = 0.953.
4. Conclusions
Iron powders were prepared using mechanical milling on the Fritsch P-6 planetary ball mill, with milling times in the range of 1–30 h. The iron powders obtained have the following typical characteristics:
- Morphology, crystal structure, particle size, porosity and saturation magnetization, coercivity change over milling time. When the time increases, the particle size and the saturation magnetization decrease, but the coercivity increases.
- The crystal structure of BCC α-Fe did not change during the milling process. Iron powder products obtained possess high purity > 97%. The increase of the impurity component is very small, in total 0.70%. Iron powder components were maintained as similar to the raw material's components. No new crystalline phases appeared in iron powder products, especially without iron oxide phases.
- The specific surface area of iron powder products increased seven times, while the average micropore diameter reduced down from 70 nm and achieved stability at 20 nm approximately, for 30 h of milling. The iron powders obtained were a kind of mesoporous materials. The porous surface area contributed over 10% of the total surface area of obtained iron powder.
- For 30 h of milling, the particle size of obtained iron powder calculated by BET was approximately 100 nm; the particle size by FESEM observation was in the range of 50–85 nm; average micropore diameter was 18 nm; the crystal size reached 7 nm; the saturation magnetization was 145 emu g−1; the coercivity was 61.57 Oe. However, the nanoparticles can be clustered up to tens of micrometers as observed by the FESEM images. It is possible to make up the artifact in the analysis.
In addition, experimental results show that acetone did not cause spurious mill products, and ensured its role as an environmental protection for iron milling process. It can be applied to the fabrication of other materials susceptible to oxidation by high-energy ball milling technique.
The manufactured iron powder has been applied and used as an air oxygen reducer which possesses a very good ability to reduce the microclimatic oxygen concentrations in a hermetic mini-environment. The kinetic of oxygen reduction process of the iron powders will be presented in detail in another publication.
Acknowledgments
The authors thank the Institute of Materials Science and Institute of Tropical Technology for all encouragement and help, as well as Vietnamese Academy of Science and Technology (VAST) and the Hanoi University for Natural Resources and Environment, which have facilitated the availability of equipment to perform this work.