

Abstract
Trichlorfon (TF) is one of the organophosphorus pesticides used widely in agriculture. The content of this paper includes the exploitation of dominant optical properties of the quantum dots consisting of a core and multilayer shell CdSe/ZnSe/ZnS (QD). A biosensor was fabricated on the basis of this QD for rapidly detecting the residues of trichlofon pesticide with concentrations of 0.01 ppm to 5 ppm. The measurements were carried out to examine the morphology of the QD structure and fluorescent properties such as transmission electron microscopy, x-ray diffraction, absorption spectroscopy and fluorescence spectroscopy. The linking mechanism among biological agents and the specificity of the acetylcholinesterase enzymes in hydrolysis reaction of acetylthiolcholine was applied to create the changes in surroundings, affecting the fluorescence of the QD. In particular, the mechanism of bioluminescence resonance energy transfer (BRET) is discussed to clearly explain the recombination of electrons and holes in the QD.
Export citation and abstract BibTeX RIS

Original content from this work may be used under the terms of the Creative Commons Attribution 3.0 licence. Any further distribution of this work must maintain attribution to the author(s) and the title of the work, journal citation and DOI.
1. Introduction
Colloidal quantum dots can be used for different applications because their band gap can be changed by altering the particle size [1]. The fluorescent emission intensity and quantum yield of the QDs increase a lot thanks to coating them with semiconductor material shells with larger bandgap. Due to the large lattice mismatch between CdSe and ZnS (about 12%), the interface strain accumulation increases with increasing shell thickness and the lattice defects can act as trapping sites for the photogenerated charge carriers [2]. We used ZnSe as the intermediate layer to solve the large lattice mismatch problem making core/shell/shell structure. In this study we fabricate CdSe/ZnSe/ZnS with the outer shell ZnS serving as a potential barrier to confine the charge carriers inside the CdSe core [3]. The optical properties of these QDs and their potential biological applications have been investigated.
Organophosphorus (OP) pesticides are the most popular insecticides in use today due to their high efficiency for insect elimination, easy synthesis, and low cost. Due to the widespread use of OP, their residues have been frequently found in soil, groundwater as well as agricultural products [4]. The residues are highly toxic substances that have been found to cause serious problems to human health even at very low concentrations [4, 5]. In order to avoid possible harm to humans and animals, there is an increasing need to develop fast and sensitive methods for detecting low concentrations of OP in the agricultural products.
Acetylcholinesterase (AChE) plays an essential role in neurotransmission at cholinergic synapses, where it rapidly hydrolyzes the excitatory neurotransmitter, acetylcholine, into choline and acetic acid [6]. In honeybees and other insects, most of the AChE activity is found in the central nervous system, rather than in the peripheral nervous system. Many compounds including organophosphorus and carbamate insecticides are commonly used to quasi-irreversibly inhibit AChE [7]. AChE has attracted a great deal of attention, and many studies have explored how its alteration may relate to insect resistance.
In this paper we report a sensitive optical biosensor for the detection of TF pesticide. The biosensor is composed of nanostructured multilayers of CdSe/ZnSe/ZnS QDs and enzyme AChE. The results demonstrate that this proposed biosensor can be applied to determine low concentrations of TF and detection limits are significantly better than those of reported biosensor so far.
2. Experimental
For the synthesis of the CdSe core QDs we used the procedure described in [8]. All chemicals used in this study were purchased from Aldrich: cadmium acetate (Cd(Ac)2, 99.9%), zinc acetate (Zn(Ac)2, 99.9%), selenium powder (Se, 99.99%), hexamethyl disilthiane (TMS)2S, trioctylphosphine oxide (TOPO, 99%), trioctylphosphine (TOP, 90%), hexadecylamine (HDA, 99%) and organic solvents (chloroform, toluene, methanol, hexane, etc). The chemicals were used as-received unless otherwise specified.
The synthetic method was carried out using standard airless procedures by filling the reaction flask with ultra-pure nitrogen gas flow. In order to fabricate CdSe QDs, we used two precursors which were Cd in TOP and TOP-Se. The molar ratios of precursors were thus the same for all samples and equal to 1/3.3 for the Cd/Se ratio. The particle growth temperature was 180–240 °C and the growth time was 20 min. To fabricate the ZnSe intermediate layer, we used the precursors Zn in TOP and TOP-Se, which were calculated for two monolayers (MLs) of ZnSe. The molar ratio of the precursors for growing the ZnSe shell was always Zn/Se = 1.37/1. The growth temperature of the intermediate layer was 200 °C and the growth time was 15 min. To coat the outermost layer, the precusors used were Zn in TOP and (TMS)2S. The growth temperature was 180–200 °C and the growth time was 15 min. Then the QDs were stored in their growth solution to ensure that the surface remained passive with TOPO and HDA. To avoid solidification of the capping TOPO molecules, toluene solvent was added. In this work for preparing each QD beside of two ZnSe monolayers we used also a ZnS multilayer with the thickness equal to 4.4 times the thickness of each ZnS monolayer. These QDs will be denoted CdSe/ZnSe 2 ML/ZnS 4.4 ML QDs. They were prepared in colloidal form and dispersed in toluene.
The QDs were surface-modified by mercaptopropionic acid (MPA) in order to assure that the QDs were water soluble and streptavidin (SA) molecules were conjugated to the QDs. AChE enzymes (EC 3.1.1.7, activity unit: 500 U/0.7 mg) and s-acetylthiocholine iodide (ATChI) were purchased from Sigma-Aldrich. The ATCh was prepared from ATChI [9]. On the basis of the avidin–biotin interaction, the AChE (2U) were conjugated to form the QDs/SA/AChE biosensors. QDs/SA and AChE were mixed and incubated at 37 °C for 10 min. Different amounts of the pesticides were added to the same corresponding amount of ATCh (2 mM), and the mixture was added to the biosensor solution. The pH values of the initial solutions were around 7.1–7.3.
The size of the core QDs and the shell thickness are determined by the transmission electron microscopy (TEM) method, a JEOL Jem 1010 microscope operating at 100 kV. The optical absorption of the QDs dilute solution in toluene was carried out using Jasco V670 UV-vis-NIR spectrometer (Shimadzu, UV-1800). The photoluminescence (PL) spectra were recorded on a fluorescence spectrophotometer under Cd–He laser at 442 nm excitation and 488 nm line from Ar+ laser. The pH of the QDs solution was measured by WTW Inolab pH720.
3. Results and discussion
Before using QDs as biosensors, we carried out research on the shapes, sizes, absorption spectra and fluoresence spectra of these QDs. The TEM images (figure 1) show that the average size of the QD core is about 3.5 nm, the size of CdSe/ZnSe 2 ML is about 6 nm and that of CdSe/ZnSe 2 ML/ZnS 4.4 ML core/shell/shell is about 11 nm. The TEM images of these samples show that the particles are mostly spherical-shaped and the sizes are relatively uniform.
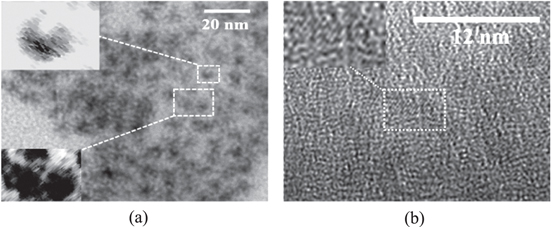
Figure 1. TEM images of CdSe/ZnSe 2 ML (a) and CdSe/ZnSe 2 ML/ZnS 4.4 ML QDs (b).
Download figure:
Standard image High-resolution imageThe absorption spectra of all samples of CdSe, CdSe/ZnSe, and CdSe/ZnSe/ZnS were carried out to estimate the QD core size. From the absorption spectra of the three mentioned QD samples, we observed a shift in the absorption peak towards longer wavelengths than the absorption peak of the CdSe core after CdSe was coated with ZnSe and ZnS. The positions of the respective absorption peaks are 530 nm, 546 nm and 586 nm (figure 2(a)). The shift of the absorption peak towards the longer wavelengths is attributed to partial leakage of the electronic wave function into the shell layers. This redshift is larger in smaller dots where the leakage of the electronic wave function into the ZnS layer has more dramatic effects on the confinement energies of the charge carriers [10].
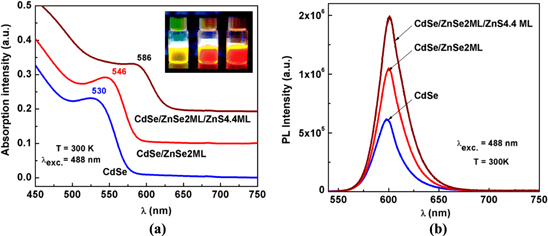
Figure 2. Absorption (a) and PL (b) spectra of CdSe; CdSe/ZnSe 2 ML; CdSe/ZnSe 2 ML/ZnS 4.4 ML.
Download figure:
Standard image High-resolution imageThe PL spectra of QDs dispersed in toluene were measured under the same excitation condition at 488 nm. Figure 2(b) shows the PL spectra of the series of samples such as CdSe, CdSe/ZnSe 2 ML and CdSe/ZnSe 2 ML/ZnS 4.4 ML under excitation wavelength at 488 nm. In the PL spectrum of the CdSe core, we observed two emission bands: one excitonic peak and one larger band with weak intensity at about 730 nm which is attributed for the surface state, but for the ZnSe intermediate layer with 2 ML, this band disappeared. PL spectra from core/shell or core/multishell consist of one sharp peak of the band-edge emission, no other broad emission is observed. This indicates that the CdSe core was perfectly protected by the double shell of ZnSe/ZnS. In this case, as ZnSe and ZnS thickness is increased, the maximum of the PL peak is shifted towards longer wavelengths about 3 nm and the rate of increase of integrated PL intensity when coated with ZnSe 2 ML shell is ∼1.5 times and ∼2.3 times when coated with shell ZnSe 2 ML and ZnS 4.4 ML. The full width at half maximum (FWHM) is not changed much (∼2 nm), which demonstrates the favorable role of ZnSe layer in decreasing of the lattice mismatch.
We developed these QDs in an attempt to improve chemical and photostability against ionization by isolating a small emitting core from its chemical environment with a thick shell graded composition of a wider-gap material. It was also hypothesized that this approach would lead to suppressed PL blinking, as the thick shell would prevent carriers from leaving the QD cores, inhibiting the formation of non-emitting charged QDs. The core/shell/shell QD structure lowers the toxicity of CdSe and gives better potential biological application due to the best protection of the CdSe core QDs from the surrounding medium, furthermore the ZnS outer shell is nontoxic.
On the basis of CdSe/ZnSe 2 ML/ZnS 4.4 ML QDs, we fabricated the fluorescence biosensor for trace detection of the TF pesticide that belongs to OP compound. After being fabricated, the QDs were modified on the surface with mercaptopropionic acid (MPA) so that they could be dispersed in water. Because of that, in water environment the QD surface would be negatively charged. The enzymes dispersed in water would also be negatively charged. For that reason, they cannot link together by the coulomb interaction. Thus, we used the streptavidin (SA) to be the 'linking bridge' between QDs and AChE enzyme [11]. The QD/SA/AChE structure is the biosensor.
The operating principle of the biosensors is based on the hydrolysis reaction of ATCh with the presence of AChE enzyme as the catalyst. In a hydrolysis reaction, ATCh would be decomposed into thiolcholine (TCh) and acetic acid (CH3COOH). On the other hand, pesticides are strong inhibitors of enzyme activity. Thus, if we use acetylthiocholine (ATCh) as the indicator for the activity of AChE enzymes [12], then we can detect the presence (much or little) of the inhibitor (TF pesticide) of AChE enzymes due to the increase or decrease of the amount of acetic acid (H+ ion concentration). The H+ ion concentration change mechanism near the surface of QDs affects the emission intensity of the solution containing the biosensor. The reason can be that if many H+ ions (protons) are generated, they can capture the electrons generated from optical excitation and move to the surface of QDs, thus decreasing the number of electrons recombining with holes for emitting. This would lead to the decrease of fluorescence intensity of the solution containing the biosensor [13].
Figure 3(a) describes the mechanism based on the hydrolysis reaction of ATCh with the catalysis of AChE enzyme to create thiocholine (TCh) and acetic acid. However, the hydrolysis reaction will not occur with the presence of TF pesticide that strongly inhibits the activity of enzyme AChE. This reduces the number of H+ ions in the solution containing the biosensor, increasing its pH value, thus increasing fluorescence intensity. So, the amount of H+ ions would affect the capture of electrons on QD surface in biosensor structure, increase or decrease the emission recombination of electron–hole pairs, leading to a change in fluorescence intensity. On the basis of this change, a trace amount of pesticides could be detected. In this study, the QD concentration and the total volume of the samples (2 ml) are constant during the experiments. When the measuring time was increased, we noticed that the fluorescence intensity of the biosensor solution decreased (figure 4(b)), due to a decrease in pH value. This observation suits the publication [14].
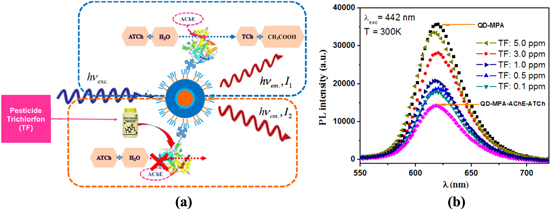
Figure 3. The biosensor model and detection mechanism (a) and integrated PL intensity of the biosensor with the TF pesticide concentrations among 0.1–5.0 ppm (b), temperature at 300 K, λexc = 442 nm.
Download figure:
Standard image High-resolution image
Figure 4. The change in PL intensity with the concentration of TF from 0.1 to 5.0 ppm (a) and the dependence of the integrated PL intensity and the duration of AChE activation (b).
Download figure:
Standard image High-resolution image
The structure of the biosensor is QDs/SA/AChE. The activation rate of enzyme AChE is 1 μmol/1 min. As above mentioned, we use AChE with 2 units (2U) and 10 mM of ATCh (162.27304 g mol−1) in the total volume of 2 ml each sample. ATCh is 20 μmol and the duration of hydrolysis reaction is about 10 min without TF. The inhibitor ATCh was mixed with TF with different concentrations ranging from 0.1 ppm to 5 ppm. The mixture is dripped into QDs/SA/AChE and the PL intensity is measured immediately after raising the temperature to 37 °C for 20 min. We compare the PL intensity of this conjugate with different pesticide concentrations to the one of the solution containing only biosensors. Figure 3(b) shows the PL spectra of QD-MPA with the maximum PL peak and the minimum of QD-MPA-AChE-ATCh. We observe that the PL intensity of the biosensor increases proportionally with the pesticide concentration ranging from 0.1 to 5.0 ppm, within which the fluorescence intensity also changes.
The mechanism of bioluminescence resonance energy transfer (BRET) was used for the explanation. QD acts as acceptor and proteins (the enzyme is attached around) as donor. In particular, the performance of this energy transfer depends on the distance between donor and acceptor rather than the ratio between donors and acceptors. Normal distance for this resonance transfer is about 2 to 9 nm [15, 16]. In the absence of pesticides (figure 3(a), green dash line), enzymes that catalyze the hydrolysis reaction should have their concentration reduced gradually, thus the number of enzymes on the surface of QDs decreases. Because of the generated acid, the number of H+ ions increases. Interaction between the charges on the QDs surface will change significantly. Thus, when the liquid mixture is exposed to excitation light, electronic energy transfer will occur, increasing the amount of electrons that the acceptor receives from the donor.
As the interactions between H+ ions and electrons increase, the recombination of excitonic emission is lessened. In this case, the fluorescence intensity is low (represented by I1 value in figure 3(a), green dash line). With the presence of pesticides (figure 3(a), yellow dash line), the phenomenon will occur contrarily. AChE enzyme is inhibited, the number of H+ ions hardly changes, because the hydrolysis reaction does not occur. The amount of enzyme in the distance of 2–9 nm from the QD surface does not change. It donates more electrons to the QDs then the fluorescence intensity increases (represented by I2 > I1 value in figure 3(a)).
Figure 4(a) describes the change in PL intensity with the TF concentrations ranging from 0.1–5.0 ppm, derived from the peak intensity of the PL spectra in figure 3(b). The peak intensity increases fairly linearly with the increase of the concentration of TF pesticide. With the change of fluorescence intensity peaks, we can see that the experimental lines (figure 4(a), blue line) nearly coincide with the linear fit line (figure 4(a), red line). Based on this graph, it is possible to extrapolate the value of the fluorescence intensity corresponding to the concentration of pesticides, respectively. This can be considered as baseline of the biosensors fabricated in this research.
Through a series of repeated experiments, we have found that the point of time to measure PL intensity after pouring pesticides into the biosensor solution is very important. In addition to the effects of pesticide concentrations, the activity of AChE enzyme is also affected by factors such as temperature, QDs concentration, or reaction durations, etc. Therefore, we conducted a survey course of the fluorescence intensity change over time for the sample series of CdSe/ZnSe/ZnS- SA- AChE at different concentrations of TF (0.5; 1.0; 3.0 and 5.0 ppm) (figure 4(b)). The PL measurement was carried out at time 10, 20, 30, 40, 50, 60, 70, 80, 90 after pouring TF into the biosensors solution.
The results showed that, during the first 30 min, PL intensity tended to increase [17, 18] (figure 4(b), the blue box) and decrease with the same rules for 60 min later. Observation shows that QDs samples then settled down, becoming dark and emitting less. The phenomenon in the first period can be explained similar to the above. During the next 60 min, hydrolysis of ATCh creates acetic acid with the amount large enough to disintegrate the ligand around the QDs, leading to their inability to disperse in water, thus reducing the emission and strongly decreasing the PL intensity.
4. Conclusions
We have studied the optical properties of the QDs and enzyme inhibition-based biosensor for pesticides detection. The change in biological hydrolysis of ATCh with the catalysis of AChE is mainly used for this purpose. The increase in PL intensity can be the base for detection of TF pesticide with the concentration in the range of 0.1 to 5.0 ppm. On the basis of the analysis of the integrated PL intensity with time, we have found the suitable period to do the PL measurement, which is 30 min after the mixture of ATCh and TF is poured into the QDs-SA-AChE solution. In our opinion, the potentials of this system are even greater considering the options that can be exploited and applied on real samples.
Acknowledgments
This research is funded by the Vietnam National Foundation for Science and Technology Development (NAFOSTED) and by the PICS project n° 6456. The authors thank the National Key Laboratory for Electronic Materials and Devices-IMS for the use of facilities. We sincerely thank Professor Nguyen Quang Liem for his precious discussions and Professor Nguyen Van Hieu for the support.