

Abstract
Manganese dioxide γ-MnO2 was synthesized via the reduction–oxidation reaction between KMnO4 and C2H5OH at room temperature and characterized with x-ray powder diffraction (XRD), scanning electron microscopy (SEM), transmission electron microscopy (TEM) and Brunauer–Emmet–Teller nitrogen adsorption (BET–N2 adsorption). The results showed that γ-MnO2 was about 10–18 nm in size and the BET surface area was about 65 m2 g−1. The feasibility of γ-MnO2 used as a low cost adsorbent for the adsorption of Pb(II), Co(II) and Cu(II) from aqueous solutions was explored. During the adsorption process, batch technique was used, and the effects of contact time and pH on adsorption efficiency under room temperature were studied. The adsorption data showed that the Freundlich, Langmuir and Redlich-Peterson isotherms are a good model for the sorption of Co(II) and Cu(II), while the Langmuir and Redlich–Peterson isotherms provide a reasonable fit to the experimental data for Pb(II). By using the Langmuir isotherm, the adsorption capacities for Pb(II), Co(II) and Cu(II) are found to be 200 mg g−1, 90.91 mg g−1 and 83.33 mg g−1, respectively. The effectiveness of γ-MnO2 in the sorption of the three metal ions from aqueous system has the order Pb(II) > Co(II) > Cu(II). Kinetic studies showed that a pseudo-second-order model was more suitable than the pseudo-first-order model. Also, the intra-particle diffusion models were used to ascertain the mechanism of the sorption process. It is concluded that γ-MnO2 can be used as an effective adsorbent for removing Pb(II), Co(II) and Cu(II) from aqueous solutions.
Export citation and abstract BibTeX RIS

Original content from this work may be used under the terms of the Creative Commons Attribution 3.0 licence. Any further distribution of this work must maintain attribution to the author(s) and the title of the work, journal citation and DOI.
1. Introduction
The tremendous increase in the use of heavy metals over the past few decades has inevitably resulted in an increased flux of metallic substances in the aquatic environment [1–3]. These pollutants enter the water environment through wastewater from metal plating industries, batteries, phosphate fertilizer, mining, pigments and stabilizers alloys [1–7].
Various treatment techniques have been applied to remove metal ions from contaminated waters such as chemical precipitation, adsorption and ionic exchange, membrane technology and solvent extraction [4–7]. Adsorption technology is considered as one of the most efficient and promising methods for the treatment of trace amount of heavy metal ions from large volumes of water because of its high enrichment efficiency, and the ease of phase separation [4–10].
Recently, the adsorption properties of nanostructured metal oxides have been applied for environment pollution removal. Because of their huge specific surface area and many unsaturated atoms on the surface, the adsorbability of nanomaterials to metal ions is very strong. Nanostrucrured manganese oxides have attracted increasing attention in view of their applications in batteries, molecular sieves, catalysts, and adsorbents [8–10].
In this study we report a simple method to synthesize MnO2 nanostructure which was used as a low cost adsorbent for the adsorption of Pb(II), Co(II) and Cu(II) from aqueous solutions. The sorption capacity of MnO2 was evaluated using Freundlich, Langmuir and Redlich–Peterson isotherm models and the sorption dynamics were analyzed using pseudo-first-order and pseudo-second-order kinetic models. Intra-particle diffusion models were also used to ascertain the mechanism of the sorption process.
2. Experimental
2.1. Chemicals and instruments
Chemicals used included potassium permanganate (KMnO4), ethyl alcohol (C2H5OH), Pb(NO3)2, Cu(NO3)2.3H2O and Co(NO3)2.6H2O, HNO3 and NaOH. All reagents used in the experiment were of analytical grade and pure of Merck.
Pb(II), Cu(II), and Co(II) were used as adsorbate. 1000 mg L−1 standard stock solution of each of the metal ions was prepared by dissolving Pb(NO3)2, Cu(NO3)2.3H2O and Co(NO3)2.6H2O, respectively, in distilled water. The concentration of metal ions in the aqueous solutions was analyzed by using AA-7000 atomic absorption spectrometer (Shimadzu Corporation).
Instruments included x-ray diffractometer D5000 made in Germany by Siemens with x-ray radiation: CuKα with λ = 1.54056 Å, ultra high resolution scanning electron microscopy S–4800, transmission electron microscope, physical absorption system Micrometrics Gemini VII, atomic absorption spectrophotometer (Spectrometer Atomic Absorption AA–7000 made in Japan by Shimadzu).
The pH measurements were done with a pH-meter (Martini Instruments Mi-150 Romania). The pH-meter was standardized using HANNA instruments buffer solutions with pH values of 4.01 ± 0.01, 7.01 ± 0.01, and 10.01 ± 0.01.
Temperature-controlled shaker (Model KIKA R 5) was used for equilibrium studies.
2.2. Synthesis of MnO2 nanostructure
MnO2 nanostructure was synthesized via the reduction–oxidation between KMnO4 and C2H5OH at room temperature for 4 h by adding gradually KMnO4 saturated solution to the mixture of C2H5OH and H2O. The effect of reaction time as well as the ratio between H2O and C2H5OH to the structure and size of crystal was studied. After the reaction was completed, the solid precipitate was washed with distilled water, and then dried at 80 °C for 12 h to get the product.
Characterization of the products: phase identification was carried out by x-ray diffraction. The surface morphology of the samples was monitored with SEM and TEM. The specific surface area was evaluated by nitrogen adsorption–desorption isotherm measurements at 77 K.
2.3. Adsorption study
The adsorption experiment was prepared by adding 0.1 g MnO2 to 50 mL heavy metal ion solution in a 100 mL conical flask. The effect of pH of the initial solution was analyzed over a pH range from 2 to 6 using HNO3 0.1 M or NaOH 0.1 M solutions (Merck). The adsorption studies were also conducted in batch experiments as a function of contact time (20, 40, 60, 80, 100, 120, 150, 180, 210 and 240 min) and metal ions concentration (from 100 mg L−1 to 500 mg L−1) for maximum adsorption. An atomic absorption spectrophotometer was used to analyze the concentrations of the different metal ions in the filtrate before and after adsorbent process.
Adsorption capacity was calculated by using the mass balance equation for the adsorbent [8–20]

where q is the adsorption capacity (mg g−1) at equilibrium, C0 and Ce are the initial concentration and the equilibrium concentration (mg L−1), respectively. V is the volume (mL) of solution and m is the mass (g) of used adsorbent.
3. Results and discussions
3.1. Synthesis of γ-MnO2 nanostructure and its adsorption to Pb2+, Cu2+ and Co2+
3.1.1. Characterization of manganese dioxide
The phase and purity of the products were firstly examined by XRD. Figure 1 shows a typical XRD pattern of the as-synthesized samples. Curves (a) and (b) are the XRD patterns of the two products obtained for 3 h and 4 h. Curves (c) and (d) are the XRD patterns of the two products obtained for 5 h and 6 h, respectively. All reflection peaks can be readily indexed to hexagonal γ-MnO2 phase. However, the as–prepared sample achieved clearly crystal structure for 5 h.

Figure 1. XRD images of as-prepared sample after different reaction times: (a) 3 h, (b) 4 h, (c) 5 h, (d) 6 h.
Download figure:
Standard image High-resolution imageThe morphologies and structure information were further obtained from SEM and TEM images. Figures 2(a)–(c) show an SEM image of the as-prepared γ-MnO2 which was synthesized at the different ratios between H2O and C2H5OH: (a) H2O:C2H5OH = 2:1 (sample M1), (b) H2O:C2H5OH = 1:1 (sample M2), (c) H2O:C2H5OH = 1:2 (sample M3). As a result, γ-MnO2 nanospheres with nanostructure were formed in the alcohol (KMnO4:C2H5OH = 1:2). It is clear that the flocculation occurred in the water solution (figure 2(a)). Figure 2(c) also shows that the products of γ-MnO2 consisted of a large amount of uniform nanospheres, with size of about 10 nm. Figure 2(d) shows the TEM image of the as-prepared γ-MnO2 nanospheres (sample M3) and the TEM image further demonstrates that the obtained product has uniform sphere morphology. The TEM image also provides the size of γ-MnO2 nanospheres from 10 to 18 nm. The BET surface area of the as-synthesized product (sample M3) was determined to be about 65 m2 g−1.

Figure 2. SEM images of γ-MnO2 at the different ratios between H2O:C2H5OH: (a) sample M1, (b) sample M2, (c) sample M3; and (d) TEM image of sample M3.
Download figure:
Standard image High-resolution image3.1.2. Effect of pH on adsorption of heavy metals
The pH is one of the imperative factors governing the adsorption of the metal ions. The effect of pH was studied from a range of 2 to 6 under the precise conditions (at optimum contact time of 120 min, 240 rpm shaking speed, with 0.1 g of the adsorbents used, and at a room temperature of 24 °C). From figure 3, with γ-MnO2 used as adsorbent, it was observed that with increase in the pH (2–6) of the aqueous solution, the adsorption percentage of metal ions (lead, cobalt and copper) all increased up to the pH 4, as shown above. At pH 4, the maximum adsorption was obtained for all the three metal ions, with 98.9% adsorption of Pb(II), 54.1% of Co(II) and 41.3% adsorption of Cu(II).
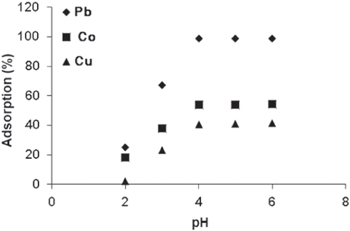
Figure 3. Effect of pH on the adsorption of heavy metals by γ-MnO2 nanostructure. (Measurement parameters: time is 120 min, agitation speed is 240 rpm, mass is 0.1 g and temperature is 24 °C).
Download figure:
Standard image High-resolution imageThe increase in adsorption percentage of the metal ions may be explained by the fact that at higher pH the adsorbent surface is deprotonated and negatively charged, hence attraction between the positively metal cations occurred [10].
3.1.3. Effect of contact time on adsorption of heavy metals
The relationship between contact time and the adsorption percentage of heavy metals from aqueous solution with γ-MnO2 adsorbent is shown in figure 4. The effect of contact time was studied at a room temperature of 24 °C, at intervals of 20 min. From the obtained result it is evident that the adsorption of metal ions increased as contact time increased. The adsorption percentage of metal ions approached equilibrium within 80 min for Pb(II), 120 min for Co(II) and 180 min for Cu(II); with Pb(II) recording 92.47% adsorption, Co(II) 81.51% and Cu(II) 89.24% adsorption. This experiment shows that different metal ions attained equilibrium at different times.
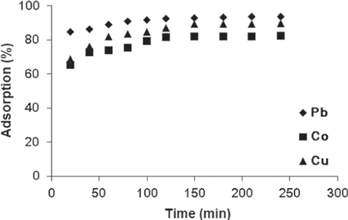
Figure 4. Effect of contact time on adsorption of heavy metals by γ-MnO2 nanostructure. (Measurement parameters: pH is 4, agitation speed is 240 rpm, mass is 0.1 g and temperature is 24 °C).
Download figure:
Standard image High-resolution image3.2. Equilibrium isotherm studies
Adsorption isotherms are mathematical models that describe the distribution of the adsorbate species among liquid and solid phases, based on a set of assumptions that are related to the heterogeneity/homogeneity of the solid surface, the type of coverage, and the possibility of interaction between the adsorbate species. In this study, equilibrium data were analyzed using the Freundlich, Langmuir and Redlich–Peterson isotherms expression.
3.2.1. Freundlich isotherm
The Freundlich (1906) equation [11–20] is an empirical equation based on adsorption on a heterogeneous surface. The equation is commonly represented as

where Ce (mg L−1) is the equilibrium concentration and qe (mg g−1) is the amount of adsorbed metal ion per unit mass of the adsorbent. The constant n is the Freundlich equation exponent that represents the parameter characterizing quasi-Gaussian energetic heterogeneity of the adsorption surface. KF is the Freundlich constant which indicates the relative adsorption capacity of the adsorbent. The Freundlich model was chosen to estimate the adsorption intensity of the sorbate on the sorbent surface. The experimental data from the batch sorption study of the three metal ions on γ-MnO2 nanostructures were plotted logarithmically (figure 5) using the linear Freundlich isotherm equation.
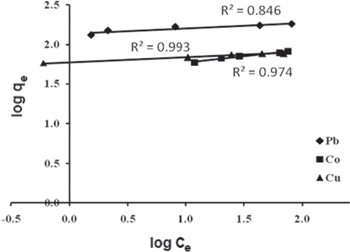
Figure 5. Freundlich equilibrium isotherm model for the sorption of the three metal ions (Pb(II), Co(II), Cu(II) onto γ-MnO2.
Download figure:
Standard image High-resolution imageThe linear Freundlich isotherm constants for Pb(II), Co(II) and Cu(II) on γ-MnO2 nanostructure are presented in table 1. The Freundlich isotherm parameter 1/n measures the adsorption intensity of metal ions on the γ-MnO2 nanostructure. The low 1/n values of Pb(II) (0.067), Cu(II) (0.064) and Co(II) (0.164) less than 1 show the favorable sorption and confirm the heterogeneity of the adsorbent. Also, they indicate that the bond between heavy metal ions and γ-MnO2 are strong. The adsorption capacity KF of the adsorbent was calculated from the isothermal linear regression equation. The KF value of Pb(II) (137.40 L g−1) is greater than that of Cu(II) (59.98 L g−1) and Co(II) (40.55 L g−1), suggesting and confirming that Pb(II) has greater adsorption tendency towards the γ-MnO2 nanostructure than the other two metals.
Table 1. Freundlich isotherm parameters.
| Samples | 1/n | KF (L g−1) | R2 |
|---|---|---|---|
| Pb(II) | 0.067 | 137.40 | 0.846 |
| Co(II) | 0.164 | 40.55 | 0.974 |
| Cu(II) | 0.064 | 59.98 | 0.993 |
3.2.2. Langmuir isotherm
The Langmuir model [11–20] assumes that uptake of metal ions occurs on a homogenous surface by monolayer adsorption without any interaction between adsorbed ions. The linearized form of the Langmuir equation is given by the relation

where qm is the sorption capacity and KL is Langmuir constant.
The Langmuir isotherm model was chosen for the estimation of maximum adsorption capacity corresponding to complete monolayer coverage on the γ-MnO2 surface. The plots of specific sorption (Ce/qe) against the equilibrium concentration (Ce) for Pb(II), Co(II) and Cu(II) are shown in figure 6 and the linear isotherm parameters, qm, KL and the coefficient of determinations are presented in table 2.
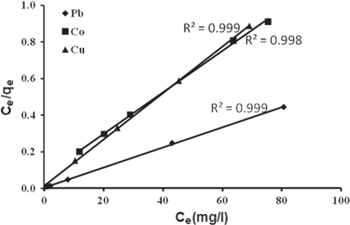
Figure 6. Langmuir equilibrium isotherm model for the sorption of the three metal ions (Pb(II), Co(II), Cu(II) onto γ-MnO2.
Download figure:
Standard image High-resolution imageTable 2. Langmuir adsorption isotherm constants for ions on γ-MnO2.
| Sample | KL | qm (mg g−1) | R2 | SF (at lowest C0 = 100 mg L−1) | SF (at highest C0 = 500 mg L−1) |
|---|---|---|---|---|---|
| Pb (II) | 1.25 | 200 | 0.999 | 0.0079 | 0.0016 |
| Co (II) | 0.16 | 90.91 | 0.998 | 0.0588 | 0.0123 |
| Cu (II) | 1.09 | 83.33 | 0.999 | 0.0091 | 0.0018 |
The data in table 2 with high values of correlation coefficient (R2 = 0.998–0.999) indicate good agreement between the parameters and confirm the monolayer adsorption of Pb(II), Co(II) and Cu(II) ions on to γ-MnO2 nanostructure surface. Furthermore, the sorption capacity qm, which is a measure of the maximum sorption capacity corresponding to complete monolayer coverage, showed that the γ-MnO2 nanostructure has a mass capacity 200 mg g−1 for Pb2+, 90.91 mg g−1 for Co2+ and 83.33 mg g−1 for Cu2+.
An important characteristic of the Langmuir isotherm is expressed in a dimensionless constant equilibrium parameter, SF, also known as the separation factor, given by

The data in table 2 shows that the dimensionless parameter SF remained between 0.008 and 0.059 (0 < SF < 1) at lowest concentration and between 0.0016 and 0.025 (0 < SF < 1) at highest concentration, i.e. the separation parameters SF for the three metals are less than unity indicating that γ-MnO2 nanostructure is an appropriate adsorbent for the three metal ions. The smaller SF value indicates a highly favorable adsorption [20, 21]. However, SF value of Co (II) > Cu (II) > Pb (II) indicates that in a mixed metal ion system, Pb(II) will be adsorbed faster than Co(II) and Cu(II).
3.2.3. Redlich–Peterson isotherm
Redlich–Peterson isotherm [11–20] is a hybrid isotherm featuring both Langmuir and Freundlich isotherms, which incorporate three parameters into an empirical equation. Then, the Redlich and Peterson equation, designated the 'three parameter equation', may be used to represent adsorption equilibria over a wide concentration range. The linearized form of the Redlich–Peterson equation is given by the relation

where KRP (L g−1), αRP (L mg−1) and β are the Redlich–Peterson isotherm constants. The value of β is the exponent which lies between 0 and 1. In the limit when the β values tend to zero the Redlich–Peterson isotherm approaches Freundlich isotherm model at high concentration and is in accordance with the low concentration limit of the ideal Langmuir condition when the β values are all close to 1.
The Redlich–Peterson isotherm constants could be predicted from the plot between  versus lnCe. However, this is not possible as the linearized form of Redlich–Peterson isotherm equation contains three unknown parameters αRP, KRP and β. Therefore, a minimization procedure is adopted to maximize the coefficient of determination R2, between the theoretical data for qe predicted from the linearized form of Redlich–Peterson isotherm equation and the experimental data. The Redlich–Peterson isotherm plots for the three metal ions (Pb(II), Co(II) and Cu(II)) are presented in figure 7 and the isotherm parameters are given in table 3.

Figure 7. Redlich–Peterson equilibrium isotherm model for the sorption of the three metal ions (Pb(II), Co(II), Cu(II)) onto γ-MnO2.
Download figure:
Standard image High-resolution imageTable 3. Redlich–Peterson isotherm parameters.
| Metal ion | KRP | αRP | β | R2 |
|---|---|---|---|---|
| Pb | 307.346 | 1.562 | 0.998 | 0.999 |
| Co | 24.134 | 0.378 | 0.932 | 0.999 |
| Cu | 3693.189 | 60.167 | 0.941 | 1.000 |
The data in table 3 indicated that, the higher R2 values for Redlich–Peterson show the agreement of experimental equilibrium data with the Redlich–Peterson isotherm equation. This was expected, because degree of heterogeneity (β) is included and this equation can be used successfully at high solute concentrations. Langmuir is a special case of Redlich–Peterson isotherm when constant β is unity.
3.2.4. Coefficients of determination
It has been suggested that linearization plots may not be a significant basis to reject or accept a model. To further analyze the suitability of the three models (Freundlich, Langmuir and Redlich–Peterson), their fitness to the experimental data was assessed. The fitness of the data was established using a single statistical parameter (R2) which is called the coefficient of determination [18, 19]. The coefficient of determination values for the three models as shown in table 4 shows that the three models are applicable in describing the data of Co(II) and Cu(II) (as all R2 > 0.90), whereas the adsorption process of Pb(II) is described by the Langmuir and Redlich–Peterson isotherm models.
Table 4. Adsorption isotherm coefficients of determination (R2).
| Heavy metals | |||
|---|---|---|---|
| Adsorption isotherm | Pb(II) | Co(II) | Cu(II) |
| Freundlich | 0.846 | 0.974 | 0.992 |
| Langmuir | 0.999 | 0.998 | 0.999 |
| Redlich–Peterson | 0.999 | 0.999 | 1.000 |
3.3. Kinetics studies
The kinetics of adsorption describes the rate of Pb(II), Co(II) and Cu(II) ions uptake on γ-MnO2 and this rate controls the equilibrium time. The kinetics of adsorbate uptake is required for selecting optimum operating conditions for the full-scale batch process.
The kinetic parameter, which is helpful for the prediction of adsorption rate, gives important information for designing and modeling the processes. The kinetics of the adsorption data was analyzed using different kinetic models such as pseudo-first-order and pseudo-second-order models. The intra-particle diffusion models are also used to ascertain the mechanism of the sorption process.
3.3.1. Pseudo-first-order model
The pseudo-first-order rate model equation given by Lagergren in 1898 is [20–29]

where qe is the amount of solute adsorbed at equilibrium per unit weight of adsorbent (mg g−1), q is the amount of solute adsorbed at any time (mg g−1) and k1 is the adsorption constant. Integrating equation (6) with conditions q(0) = 0 and q(t) = qt, the kinetic rate expression becomes

The first-order rate constant k1 (min−1) can be obtained from the slope of the plot of log(qe–qt) against time t, as shown in figure 8(a) and table 5. The adsorption first-order rate constants were found to be 4.606.10−3, 0.0115 and 4.606.10−3 min−1 for metal ions Pb(II), Co(II) and Cu(II), respectively.
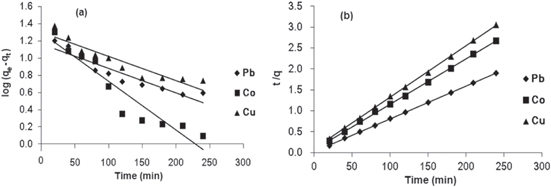
Figure 8. (a) Pseudo-first-order kinetic plots for the adsorption of metal ions, (b) pseudo-second-order kinetic plots for the adsorption of metal ions.
Download figure:
Standard image High-resolution imageTable 5. Pseudo-first-order and pseudo-second-order for the adsorption of metal ions on γ-MnO2.
| Metal ions | ||||
|---|---|---|---|---|
| Models | Parameters | Pb (II) | Co (II) | Cu (II) |
| qe (exp) | 126.10 | 89.76 | 78.58 | |
| Pseudo–first–order kinetic | K1(min−1) | 4.606.10−3 | 0.0115 | 4.606.10−3 |
| r2 | 0.886 | 0.898 | 0.870 | |
| qe (cal) | 14.62 | 19.23 | 19.91 | |
| Pseudo–second–order kinetic | K2 (g mg−1 min−1) | 1.88.10−3 | 1.25.10−3 | 1.45.10−3 |
| h (mg mg−1 min−1) | 38.46 | 12.5 | 10.10 | |
| R2 | 1 | 0.999 | 0.999 | |
| qe (cal) | 142.86 | 100 | 83.33 | |
If the adsorption process can be described by pseudo-first order equation, there should be good linear relationship between log(qe–qt) and t. In the present study, the plot of log(qe–qt) versus time t was not linear over the entire time range, the correlation coefficients in this model for all metal ions were low. Also, the theoretical qe values estimated from the first-order kinetic model were not in accordance with the experimental values. This suggests that this adsorption system is not a first-order reaction, indicating that more than one mechanism was involved in adsorption.
3.3.2. Pseudo-second-order model
Adsorption kinetics was explained by the pseudo-second-order model given by Ho and McKay as follows [20–29]

With the boundary conditions q(0) = 0, q(t) = qt the solution of equation (8) is

Additionally, the initial adsorption rate h (mg mg−1 min−1) can be determined as

where k2 (g mg−1 min−1) is the second-order rate constant determined from the plot of t/q against t, as shown in figure 8(b) and table 5.
The plots of t/q versus t are linear for different metal ions. The adsorption second-order rate constants were found to be 1.88.10−3, 1.25.10−3 and 1.45.10−3 g mg−1 min−1 for metal ions Pb(II), Co(II) and Cu(II), respectively. The initial sorption rate, h, is the highest for Pb(II) and the lowest for Cu(II), which reflects the affinity of the sorbent for these absorbate species.
The results showed that the theoretical qe values calculated from pseudo-second order kinetic model were very close to the experimental values of equilibrium sorption with correlation coefficients of determination higher than 0.999. The pseudo-second-order adsorption mechanism was predominant for adsorption of metal ions Pb(II), Co(II) and Cu(II) by γ-MnO2. The applicability of this model showed that the sorption process is complex and involves more than one mechanism.
3.3.3. Intra-particle diffusion model
Because the pseudo-first-order and pseudo-second-order kinetic models cannot identify the diffusion mechanisms, the most commonly used technique for identifying the diffusion mechanism involved in the adsorption process is to use the intra-particle diffusion model.
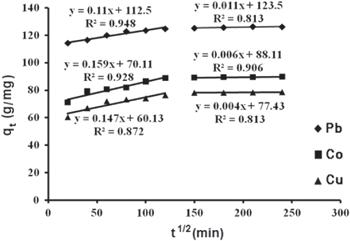
The intra-particle diffusion model used here refers to the theory proposed by Weber and Morris, based on the following equation for the rate constant [26–30]

where qt is the quantity of metal ions adsorbed at time t (mg g−1), kd the initial rate of intra-particular diffusion (mg L−1 min −1/2), and C is the y-intercept which is proportional to the boundary layer thickness.
According to this model, when the metal ion solution is mixed with the adsorbent, transport of the metal ions from the solution through the interface between the solution and the adsorbent occurs into the pores of the particles. If adsorption of a solute is controlled by the intra-particle diffusion process, a plot of qt versus t1/2 gives a straight line [26–28]. Figure 9 illustrates the diffusion of Pb(II), Co(II) and Cu(II) ions within γ-MnO2 as a function of time and shows that intra-particle diffusion occurred in two stages, first linear portion (stage I) and second curved path followed by a plateau (stage II). In stage I, the metal ions were up taken by γ-MnO2. This is attributed to the utilization of the most readily available adsorbing sites on the adsorbent surfaces. In stage II, very slow diffusion of adsorbate from surface site into the inner-pores is observed. Thus, the initial portion of adsorption of Pb(II), Co(II) and Cu(II) ions by γ-MnO2 adsorbents may be governed by the initial intra-particle transport of Pb(II), Co(II) and Cu(II) ions controlled by surface diffusion process and the later part is controlled by pore diffusion. The intra-particle diffusion constants for all two stages (kd1, kd2) are given in table 6.
Figure 9. Plot of the intra-particle diffusions kinetics for the three heavy metal ions Pb(II), Co(II) and Cu(II).
Download figure:
Standard image High-resolution image
Table 6. The values of the intra-particular diffusion coefficients.
| Metal ion | Kd1 (mg L−1 min−1/2) | Kd2(mg L−1 min−1/2) |
|---|---|---|
| Pb(II) | 0.11 | 0.011 |
| Cu(II) | 0.147 | 0.004 |
| Co(II) | 0.159 | 0.006 |
4. Conclusion
Manganese dioxide γ-MnO2 was synthesized via the reduction–oxidation reaction between KMnO4 and C2H5OH at room temperature. The results showed that γ-MnO2 was about 10–18 nm in size and the BET surface area was about 65 m2 g−1. The feasibility of γ-MnO2 used as a low cost adsorbent for the adsorption of Pb(II), Co(II) and Cu(II) from aqueous solutions was explored. The results of adsorption performance showed that the pH of aqueous solution, adsorption time has a great influence on the adsorption performance.
The experimental results were analyzed using three adsorption isotherm models, the Freundlich, Langmuir and Redlich–Peterson, isotherm models. By using the Langmuir isotherm, the adsorption capacities for Pb(II), Co(II) and Cu(II) are found as 200 mg g−1, 90.91 mg g−1 and 83.33 mg g−1, respectively. The effectiveness of γ-MnO2 nanostructure in the sorption of the three metals from aqueous system has Pb(II) > Co(II) > Cu(II). The separation parameters, SF, for the three metals are less than unity indicating that γ-MnO2 nanostructure is an appropriate adsorbent for the three metal ions. However, SF values of Pb(II) < Cu(II) < Co(II), indicate that in a mixed metal ion system, Pb(II) will be adsorbed faster than Co(II) and Cu(II). Kinetic studies showed that a pseudo-second-order model was more suitable than the pseudo-first-order model. The intra-particle diffusion models were also used to ascertain the mechanism of the sorption process.