

Abstract
The authors report the synthesis of Fe3O4 nanoparticles by wet chemical reduction technique at ambient temperature and its characterization. Ferric chloride hexa-hydrate (FeCl3 · 6H2O) and sodium boro-hydrate (NaBH4) were used for synthesis of Fe3O4 nanoparticles at ambient temperature. The elemental composition of the synthesized Fe3O4 nanoparticles was determined by energy dispersive analysis of x-rays technique. The x-ray diffraction (XRD) technique was used for structural characterization of the nanoparticles. The crystallite size of the nanoparticles was determined using XRD data employing Scherrer's formula and Hall–Williamson's plot. Surface morphology of as-synthesized Fe3O4 nanoparticles was studied by scanning electron microscopy. High resolution transmission electron microscopy analysis of the as-synthesized Fe3O4 nanoparticles showed narrow range of particles size distribution. The optical absorption of the synthesized Fe3O4 nanoparticles was studied by UV–vis–NIR spectroscopy. The as-synthesized nanoparticles were analyzed by Fourier transform infrared spectroscopy technique for absorption band study in the infrared region. The magnetic properties of the as-synthesized Fe3O4 nanoparticles were evaluated by vibrating sample magnetometer technique. The thermal stability of the as-synthesized Fe3O4 nanoparticles was studied by thermogravimetric technique. The obtained results are elaborated and discussed in details in this paper.
Export citation and abstract BibTeX RIS

Original content from this work may be used under the terms of the Creative Commons Attribution 3.0 licence. Any further distribution of this work must maintain attribution to the author(s) and the title of the work, journal citation and DOI.
1. Introduction
Iron is one of the most abundant and widely used elements on earth. Recently iron oxides nanoparticles have a huge potential for different applications including magnetic fluids [1], catalysts for carbon nanotube formation [2], magnetic resonance imaging (MRI) contrast agents [3, 4], nickel–iron batteries, catalysts and sorbents for environmental remediation [4, 5]. Depending on the application, different forms of iron nanoparticles are needed. For example, for Ni–Fe batteries and environmental remediation, nanosized aggregated iron powder is suitable. However, well dispersed colloidal iron is required for applications in biological systems such as MRI contrast enhancement and biomaterials separation. In another important application, carbon nanotubes can be grown on silicon by chemical vapor deposition using iron, cobalt, or nickel nanoparticles as the catalysts. To prevent interference between nanotubes, especially in the application of field-emission sources, dispersive separation of nanoparticles on the substrate is very important [6]. A wide variety of methods have been reported for synthesis of Fe3O4 nanoparticles, including co-precipitation [7], sol–gel method [8], flow injection [9], electrochemical [10], solvothermal [11], hydrothermal [12], microwave-assisted [13], thermal decomposition of iron (III) acetylacetonate in tri (ethylene glycol) [14] etc. Here we report the simple wet chemical reduction method for synthesis of Fe3O4 nanoparticles at ambient condition. The synthesized Fe3O4 nanoparticles are comprehensively characterized. The obtained results are deliberated in this research paper.
2. Experimental details
2.1. Synthesis of Fe3O4 nanoparticles
The Fe3O4 nanoparticles were synthesized by wet chemical reduction technique. In the synthesis, 10 ml of 2.5 M sodium boro-hydride (NaBH4; Sisco Chem, Mumbai, India) solution was prepared in a 100 ml clean glass dry beaker under magnetic stirring. Then 40 ml 0.1 M ferric chloride hexa-hydrate (FeCl3 · 6H2O; Loba Chemie, Mumbai, India) solution was prepared and added drop wise in to the first solution under vigorous stirring. With gradual addition of ferric chloride solution the final solution became darker and eventually became complete black. Black precipitates were produced in less than 1 min. after the addition of complete ferric chloride. The reaction proceeded by generation of bubbles. The reaction was presumed to be complete once bubble formation ceased. The Fe3O4 nanoparticles were filtered and given multiple wash using distilled water and absolute methanol. The particles were dried in oven for overnight at 50 °C.
2.2. Characterization
The chemical composition analyses of the as-synthesized nanoparticles were done by energy dispersive x-rays analysis (EDAX) attached to XL 30 ESEM scanning electron microscope. Size determination and morphology study of the nanoparticles were done using transmission electron microscopy (TEM), JEOL JEM-2100 and scanning electron microscopy (SEM), LEO 1430 VP, respectively. The crystal structure study was carried out by powder x-ray diffraction (XRD), Philips X'Pert MPD. The chemical bond structure of the nanoparticles was recognized by Fourier transform infrared spectroscopy (FTIR), Perkin Elmer Spectrum GX. The optical absorption spectrum was recorded using Perkin-Elmer Lambda-19 spectrophotometer. Magnetic properties of the nanoparticles were studied by the vibrating sample magnetometer (VSM), quantum design, 14 T PPMS. The thermogravimetric (TG) curve was recorded from ambient temperature to 1124 K at a heating rate of 5 K min−1 in inert N2 atmosphere using Mettler Toledo thermal analyzer.
3. Results and discussion
3.1. Chemical characterizations
3.1.1. Energy dispersive x-rays analysis (EDAX)
Figure 1 shows the EDAX spectrum of synthesized Fe3O4 nanoparticles. The EDAX data of weight % of as synthesized Fe3O4 nanoparticles are; Fe: 74.5% and O: 25.5%. The EDAX spectrum shows only Fe (iron) and O (oxygen) elements without any impurities. Hence, the EDAX analysis states that the as synthesized Fe3O4 nanoparticles are in perfect stoichiometry.

Figure 1. EDAX spectrum of synthesized Fe3O4 nanoparticles.
Download figure:
Standard image High-resolution image3.1.2. Fourier transform infrared spectroscopy (FTIR)
The FTIR spectrum of dispersed Fe3O4 nanoparticles in de-ionized water is shown in figure 2. The peak at 3414.89 cm−1 are due to O–H stretching vibration arising from hydroxyl groups from the water on nanoparticles. The absorption peaks at 2926.22, 2860.65, 1628.61, 1385.22 and 1020.54 cm−1 are due to de-ionized water used as solvent. The 695.29 and 468.80 cm−1 absorption peaks corresponds to the Fe–O bond vibration of Fe3O4 nanoparticles. These peaks values nearly matches with the reported values of Kim et al [15].
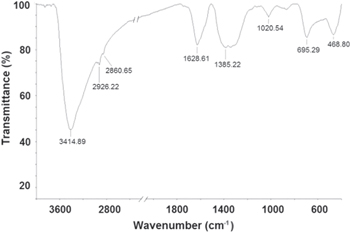
Figure 2. FTIR spectrum of dispersed Fe3O4 nanoparticles in de-ionized water.
Download figure:
Standard image High-resolution image3.2. Structural characterizations
3.2.1. X-ray diffraction (XRD)
Figure 3 shows the powder XRD pattern of synthesized Fe3O4 nanoparticles. The diffractions peaks could be indexed as that of cubic structure of Fe3O4 phase having lattice parameter a = 8.39 Å. The lattice parameter is in good agreement with the standard data (JCPDS: 19-0629). The XRD did not show any other phases such as FeO, Fe2O3, etc. The particles size was calculated from the XRD data using Scherrer's equation [16]

where D is particle size, k is the grain shape factor taken as unity contemplating that the particles are spherical in shape, λ is the incident x-ray wavelength of Cu–Kα radiation and θ is the Bragg's angle, β is the broadening of diffraction line measured at half maximum intensity (radians). The determined particle size came out to be 7.20 nm.

Figure 3. Powder x-ray diffraction pattern of synthesized Fe3O4 nanoparticles.
Download figure:
Standard image High-resolution image3.2.2. Hall–Williamson analysis
The grain size and the micro strain in the as-synthesized Fe3O4 nanoparticles were estimated using the XRD data by Hall–Williamson relation [16]

The Hall–Williamson's equation incorporates the Scherrer's formula of grain size and the micro strain term. Here β is full width at half maximum of the diffraction peaks, which is expressed as a linear combination of the contributions from the strain ( ) and grain size (L). In contour to the equation (2), the plot of (βcosθ)/λ versus 4sinθ/λ is a straight line. Figure 4, in which the reciprocal of an intercept on (βcosθ)/λ axis gives the average grain size and the slope, gives the residual strain. The grain size determined from the intercept comes out to be ∼6.58 nm. This grain size value is in good agreement with the value obtained from the Scherrer's equation. The residual strain obtained from the slope of the plot is 4.31 × 10⁻³ for the as-synthesized Fe3O4 nanoparticles. The positive value of the residual strain for the Fe3O4 nanoparticles indicates it to be tensile strain.
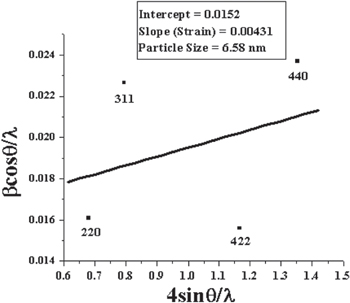
Figure 4. Hall–Williamson plot for Fe3O4 nanoparticles.
Download figure:
Standard image High-resolution image3.3. Morphological analysis
3.3.1. Scanning electron microscopy
Figure 5 shows the SEM images of the as-synthesized Fe3O4 nanoparticles that reveals the surface topography. The SEM image of figure 5(a) clearly indicates that the products are composed of spheres having uniform flower-like features. The magnified image shown in figure 5(b), of the sphere surface clearly shows that the entire sphere surface is covered by flower-like architecture, which is built from several nano-sheets. The magnified SEM image, figure 5(b), reveals that the flowers are formed of nano-sheets on the spherical surfaces having voids.
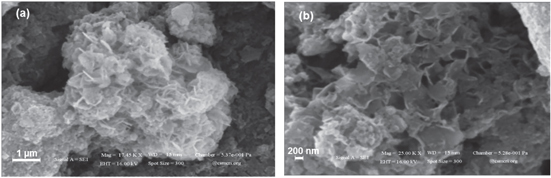
Figure 5. Scanning electron microscopy (SEM) images of the as-synthesized Fe3O4 nanoparticles at different scale bar (a) and (b).
Download figure:
Standard image High-resolution image3.3.2. Transmission electron microscopy (TEM)
The morphology and size study of the as-synthesized Fe3O4 nanoparticles were done by high resolution transmission electron microscopy (HRTEM). The samples used for HRTEM observations were prepared by dispersing the particles in de-ionized water under sonication of 30 min, then placing a drop of the dispersion onto a copper grid coated with a layer of amorphous carbon. Figure 6 shows the HRTEM images of Fe3O4 nanoparticles at two different magnifications. The HRTEM images divulge that the particles are spherical in shape corroborating the SEM observation. The images also shows that the synthesized Fe3O4 nanoparticles are distributed uniformly and spheres are interconnected with each other. From this micrograph it is noticed that the particles have an average size of about 8 nm. This result is in accordance with the results obtained from the XRD.

Figure 6. High resolution transmission electron microscopy (HRTEM) images of the synthesized Fe3O4 nanoparticles at different scale bar (a) and (b).
Download figure:
Standard image High-resolution image3.4. Optical study
3.4.1. UV–vis analysis
Figure 7 shows the optical absorbance spectrum of the as-synthesized Fe3O4 nanoparticles at ambient temperature. The clear colloid obtained after 30 min sonication of Fe3O4 nanoparticles dispersed in de-ionized water was used as a sample and only de-ionized water was used as reference. The absorbance spectrum shows the absorbance is in the visible range of the wavelength. The absorption peak is at 370 nm, while the absorption edge lies between 375 and 650 nm.

Figure 7. Optical absorbance spectrum of the synthesized Fe3O4 nanoparticles at ambient temperature.
Download figure:
Standard image High-resolution image3.5. Magnetic study
3.5.1. Vibrating sample magnetometer (VSM)
Magnetic properties of the as-synthesized Fe3O4 nanoparticles sample was studied with the help of VSM. The variation of magnetization (M) versus the applied magnetic field (H) for the Fe3O4 nanoparticles measured at 10 and 300 K temperature is shown in figure 8. In both the cases, the magnetization increases with increasing magnetic field and saturates at higher magnetic fields. From this figure it is worth noting that the coercive field and remanence magnetization is very small (approximately zero). These are characteristics of super paramagnetic particles. At higher magnetic fields all the particle's magnetic moments align themselves along the applied field direction giving rise to saturation of the magnetization. The low temperature (10 K) M–H curve reveals that the value of saturation magnetization (Ms) is 26.03 emu g−1 and the remnant magnetization (Mr) and coercivity field are very small (approximately zero). The M–H curve for 300 K reveals that the saturation magnetization (Ms) is 19.19 emu g−1 and the remnant magnetization (Mr) and coercivity field is also about zero.

Figure 8. Variation of magnetization (M) versus the applied magnetic field (H) of the Fe3O4 nanoparticles measured at 10 and 300 K temperature.
Download figure:
Standard image High-resolution imageThe variation of magnetization as a function of temperature for the as-synthesized Fe3O4 nanoparticles is shown in figure 9 for two different applied magnetic fields, (a) 10 000 Oe and (b) 500 Oe. The temperature variation was from 4 to 320 K. The figure 9 for both the applied magnetic fields shows that the magnetization value decreases slowly with increasing temperature. The magnitude decrease of magnetization with temperature is more in case of applied magnetic field of 10 000 than 500 Oe. This magnetization behavior is in line to natural behavior of magnetic samples.
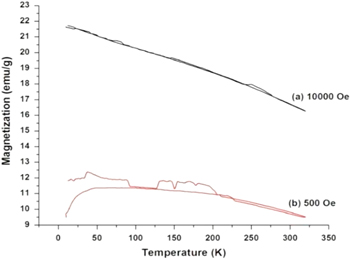
Figure 9. Variation of magnetization as a function of temperature for the as-synthesized Fe3O4 nanoparticles for two different applied magnetic fields, (a) 10 000 Oe and (b) 500 Oe.
Download figure:
Standard image High-resolution image3.6. Thermal study
3.6.1. TG analysis
The TG curve for Fe3O4 nanoparticles is shown in figure 10. The TG curve was measured from room temperature to 1124 K in the inert N2 atmosphere at heating rate of 5 K min−1. In this temperature range the sample showed continuous weight loss as the temperature increased from room temperature to 1124 K. The complete weight loss was divided into four steps viz room temperature to 499 K, 500 to 734 K, 735 to 934 K and 935 to 1124 K.

Figure 10. The thermogravimetric curve for Fe3O4 nanoparticles.
Download figure:
Standard image High-resolution image
The activation energy of the Fe3O4 nanoparticles in the four different steps of thermal decompositions such as: step-I from room temperature to 499 K, step-II from 500 to 734 K, step-III from 735 to 934 K and step-IV from 935 to 1124 K of TG curve was calculated using Broido [17] and Piloyan–Novikova (P–N) [18] relations. The values of activation energy of four decomposition steps calculated using the two different relations are tabulated in table 1.
Table 1. Activation energy evaluated using the non-mechanistic equations for the as-synthesized Fe3O4 nanoparticles.
| Activation energy (eV) determined by different relations | ||||
|---|---|---|---|---|
| Step | TGA temperature range (K) | Mass loss (%) | Broido | Piloyan–Novikova (P–N) |
| I | Room temperature–499 | 9.14 | 0.20 | 0.23 |
| II | 500–734 | 3.46 | 0.23 | 0.27 |
| III | 735–934 | 1.51 | 0.25 | 0.27 |
| IV | 935–1124 | 1.48 | 0.27 | 0.32 |
The values of the activation energy for four steps determined by two different methods are in good agreement with each other.
4. Conclusion
The Fe3O4 nanoparticles were successfully synthesized by simple chemical reduction technique. The EDAX analysis of Fe3O4 nanoparticles confirmed that the synthesized nanoparticles were perfectly stoichiometric and do not contain any other impurity elements. The powder XRD confirmed that the synthesized Fe3O4 nanoparticles possess cubic structure having lattice parameter a = 8.39 Å. The structure and the lattice parameter are in good agreement with the reported value. The crystallite size determined from XRD using Scherrer's equation and Hall–Williamson's plot were 7.20 and 6.58 nm, respectively. Both the values are in good agreement with each other. The SEM image clearly indicates that the as-synthesized Fe3O4 nanoparticles are composed of spheres having uniform flower-like features. The magnified image of the sphere surface clearly shows that the entire sphere surface is covered by flower-like architecture, which is built from several nano-sheets. The HRTEM morphology of Fe3O4 nanoparticles clearly showed the particles are spherical in shape. The particles have an average size of about 8 nm. This value is in good agreement with the crystallite size determined from XRD pattern using Scherrer's equation and Hall–Williamson plot.
The study of variation of magnetization (M) versus the applied magnetic field (H) for the as-synthesized Fe3O4 nanoparticles for temperatures, 10 and 300 K, showed the magnetization increases with increasing magnetic field and saturates at higher magnetic fields. The value of saturation magnetization (Ms) for as-synthesized Fe3O4 nanoparticles is 26.03 and 19.19 emu g−1 for 10 and 300 K, respectively. The remnant magnetization (Mr) and coercivity field are very small (approximately zero) at both the measured temperatures. The variation of magnetization as a function of temperature for as-synthesized Fe3O4 nanoparticles from 4 to 320 K at 10 000 and 500 Oe showed that the magnitude decrease of magnetization with temperature is more for applied magnetic field of 10 000 than 500 Oe.
The TG curve for Fe3O4 nanoparticles from room temperature to 1124 K in the inert N2 atmosphere showed continuous loss in weight as temperature increased from room temperature to 1124 K. The TG weight loss was seen to have four steps. The activation energy determined for the four steps using Broido and P–N relations showed the values are in good agreement with each other.
Acknowledgments
All the authors are thankful to the Sophisticated Instrumentation Centre for Applied Research & Testing (SICART), Vallabh Vidyanagar, Gujarat, India for FTIR analysis. The authors are grateful to the Department of Metallurgical Engineering, Faculty of Engineering and Technology, M S University of Baroda, Vadodara, India for EDAX analysis of our samples. The authors are grateful to the Central Salt and Marine Chemical Research Institute, Bhavnagar for TG, HRTEM and SEM analysis. The authors are thankful to UGC-DAE Consortium for Scientific Research, Indore, India for VSM analysis.