

Abstract
One-dimensional (1D) porous carbon nanofibers (CNFs) decorated by silver (Ag) nanoparticles (NPs) were prepared using a one-pot/self-template synthesis strategy by combining electrospinning and carbonization methods. The characterization results revealed that AgNPs were homogenously distributed along the CNFs and possessed a relatively uniform nano-size of about 12 nm. The novel membrane distinctively displayed enhanced photocatalytic activity under visible-light irradiation. The membrane exhibited excellent dye degradation and bacteria disinfection in batch experiments. The high photocatalytic activity can be attributed to the highly accessible surface areas, good light absorption capability, and high separation efficiency of photogenerated electron–hole pairs. The as-prepared membranes can be easily recycled because of their 1D property.
Export citation and abstract BibTeX RIS

Original content from this work may be used under the terms of the Creative Commons Attribution 3.0 licence. Any further distribution of this work must maintain attribution to the author(s) and the title of the work, journal citation and DOI.
1. Introduction
Increasing demand and shortage of clean water sources due to the rapid development of industrialization, population growth, and long-term droughts has become an issue worldwide [1]. It is estimated that around 4 billion people worldwide experience lack of or little access to clean and sanitized water supply, and millions of people die of severe waterborne diseases annually [2]. Currently available water treatment technologies have limitations such as lack of complete depollution ability, high cost, or generation of secondary pollution into the ecosystem [3, 4]. While the traditional chlorination process is still the preferred disinfection method in water purification because of its low cost [3], the development of bacterial resistance and health risks associated with disinfection byproducts require alternative solutions [5].
Recently, tremendous effort has been made to develop novel and cost-effective water purification technologies such as advanced oxidation processes and germicidal ultraviolet (UV) radiation to solve the problem of the widespread biorecalcitrant and organic water pollutants [6]. Photocatalysis has proven to be a 'green' method with significant potential for complete decomposition of organic pollutants and deactivation of bacteria in the environment [7–9]. Most of the nanostructured photocatalysts reported to date are TiO2-based materials, which require UV light for effective photocatalysis, or have been constructed in nanoparticle form, which is difficult to separate and recycle [10–12] and severely limits their application range. Materials with one-dimensional (1D) structure, in particular nanofibers, may overcome these problems [13]. Electrospinning is an attractive approach for generating nanofibers with diameters in the nanometer to micrometer range through the action of a strong electric field imposed on a polymer solution or melt [14]. In addition to its high production rate, low cost, and simplicity, the unique ability of electrospinning is efficiently forming a well-defined 1D membrane with controllable architecture. Recently, a new class of 1D carbon–semiconductor hybrid photocatalyst has attracted considerable attention [6, 15, 16]. These composite photocatalysts promise desirable quantum efficiency in separating electron–hole pairs [6]. So far, composites of 1D semiconductor/carbon nanofiber (CNF) such as TiO2@carbon embedded by silver nanoparticles (AgNPs) [17], TiO2@carbon core/shell nanofiber [13], and ZnO-carbon nanofiber [18] have been synthesized and exhibited high photocatalytic activity. Vanadium oxides are extensively used as catalysts with a band gap of approximately 2.6 eV [19]. This narrow band gap could make it a type of prospective solar light active catalyst. However, the rapid electron–hole pair recombination causes VOx-containing catalysts to exhibit low activity under both UV and visible light [20]. To obtain efficient photocatalysts, the synthesis protocol is very important [21–23]. Thus, it is attractive to integrate two or more kinds of nanomaterials into single units to enable the creation of multifunctional materials with new or improved properties [24]. On the other hand, it is challenging to synthesize the composite in a one-step and controlled manner [25]. In our previous work [26], vanadium oxide-embedded mesoporous porous carbon nanofibers CNFs (V-CNF) was prepared based on one-pot/self-template synthesis strategy, which showed good photocatalytic activity. It was found that the mesoporous structure creates multi-channeled reaction sites available for efficient mass transfer that provide a highly accessible surface area for the adsorption and photodegradation of contaminants. Moreover, the generated pores in CNFs connect the embedded VOx and the surface of the CNFs, which facilitates electron transfer.
On the other hand, the antibacterial property is an important function for engineering nanomembranes for feasible application in water. Inhibition of bacterial growth is advantageous for membrane-biofouling control and promotes its practical application [27]. Silver has shown enhanced electron-hole separation and interfacial charge transfer abilities, and it was employed for enhancing the visible-light excitation of various semiconductors such as ZnO, BiVO4, and TiO2 [27–29]. AgNPs are also known to exhibit the highest antibacterial activity and biocompatibility among antibacterial nanomaterials [30–32]. Hence, this work proposes that by incorporating VOx into a CNF matrix and decorating the surface with AgNPs, a highly efficient photodegradation catalyst with antibacterial function can be prepared.
In this study we present an efficient photocatalyst of 1D mesostructured VOx-embedded CNF membranes decorated with AgNPs (Ag@V-CNF-1 and Ag@V-CNF-2) by combining electrospinning and carbonization. The photocatalytic and disinfiction activities of the prepared membrane photocatalysts were investigated by measuring the organic dye degradation and bacteria disinfection. The experimental results showed that the prepared membranes exhibited excellent photocatalytic and antibacterial performance in batch experiments. Moreover, due to the large length-to-diameter ratio of CNFs, they can be restored easily by sedimentation without a decrease in activity. Finally, the photocatalysis mechanism is proposed.
2. Experimental methods
2.1. Chemicals
Poly(acrylonitrile) (PAN, Mw = 150 000), poly(vinylpyrrolidone) (PVP, Mw = 1 300 000), ammonium metavanadate (NH4VO3) N, N-dimethylformamide (DMF), methylene blue (MB), methyl orange (MO), and rhodamine B (RhB) were purchased from Aldrich Chemical Co. Silver nitrate (AgNO3) was provided by Sinopharm Chemical Reagent Company. All these materials were used without further purification.
2.2. Synthesis of mesostructured Ag@V-CNF composite membranes
The synthesis principle of the composite membranes is presented in the appendix. The preparation process is shown in figure 1. In a typical one-boat synthesis, NH4VO3 solution was prepared by dissolving 0.1 g of NH4VO3 in 9.0 g of DMF at 80 °C for 3 h with vigorous stirring to form a purple solution. Thereafter, 1.0 g of PAN was added with continuous stirring at the same temperature for 2 h to form a yellowish homogenous solution. The solution was then cooled down to room temperature (about 23 °C). AgNO3 solution was prepared by dissolving 0.05 g of AgNO3 in 9.0 g of DMF at room temperature with vigorous stirring for 30 min, followed by the addition of 1.0 g of PVP. The mixture was stirred for another 30 min. These steps were performed under complete protection from direct light. The two solutions were mixed and stirred at room temperature for 2 h. The obtained viscous yellowish solution was drawn into a hypodermic syringe for electrospinning. The positive voltage applied to the tip was 15 kV, and the distance between the needle tip and collector was 20 cm. A dense network of membrane fibers was collected on the aluminum foil. For carbonization, the substrates were first placed in a tube furnace and stabilized in air for 4 h at 250 °C. The substrates were then subjected to nitrogen gas at 800 °C at a ramp rate of 5 °C min−1, after which they were cooled to room temperature. The obtained CNF was denoted as Ag@V-CNF-1. The Ag@V-CNF-2 was obtained by adding 0.1 g of AgNO3. The same method was used to prepare V-CNF (without AgNO3), and Ag-CNF (without NH4VO3) for comparison studies. Detailed description of the characterization apparatus and measurements, photocatalysis, and antibacterial tests are provided in the appendix.

Figure 1. SEM image of (A) the pure CNFs, (B) V-CNF, (C) the Ag@V-CNF-1, and (D) Ag@V-CNF-2.
Download figure:
Standard image High-resolution image3. Results and discussion
3.1. Characterization of Ag@V-CNF membranes
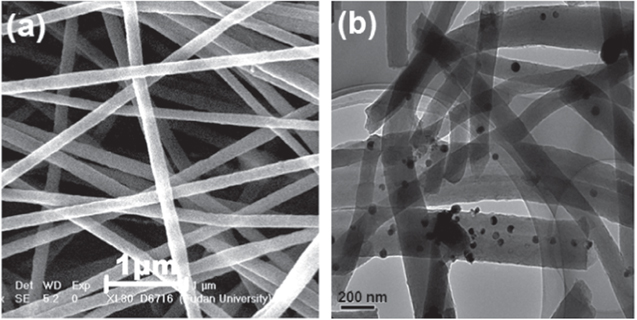
Figures 1(A)–(D) show the scanning electron microscopy (SEM) images of pure CNFs, V-CNF, Ag@V-CNF-1, and Ag@V-CNF-2 membranes, respectively. The SEM images of pure CNFs show randomly oriented CNFs with smooth and uniform surface (figure 1(A)). The diameter of the pure CNFs ranged from 250 nm to 300 nm. The SEM image of V-CNF indicates the nanofibers became curvy and their diameters were in the same range as the pure CNFs. The Ag@V-CNF-1 and Ag@V-CNF-2 SEM images show the same curvy nanofiber although the fiber diameter was slightly increased (approximately 350 nm), which was likely from the high viscosity due to the addition of NH4VO3 and AgNO3 into polymer solution. However, all images revealed a smooth surface of the fibers without the mass of vanadium or silver particles. The absence of these masses suggests their successful incorporation into the carbon-fiber matrix. The latter images show that the nanofiber morphology can remain intact after carbonization.
Figures 2(A) and (A') present the transmission electron microscopy (TEM) and high-resolution transmission electron microscopy (HRTEM) images of pure CNFs, respectively. The CNFs had a smooth and uniform surface without any other nanostructures, which is consistent with the SEM observation. Figures 2(B) and (B') show the TEM and HRTEM images of V-CNF, respectively. A homogenous dispersion of VOx was observed in the CNFs matrix that appeared in a white worm-like structures, which previously grew in the black CNFs. These white structures were caused by NH4VO3 decomposition and oxygen dissociation in CNFs during the carbonization. This process resulted in the generation of the pores that could connect the VOx embedded in the CNFs matrix to the surface. The TEM and HRTEM images of Ag@V-CNF-1 shown in figures 2(C) and (C') reveal a homogenous distribution of AgNPs on the surface of the VOx-embedded CNFs. The AgNPs appeared as deep dark spherical spots and were notably grown only over the white worm-like structures along the CNFs, suggesting an electrostatic interaction of Ag ions and vanadyl groups. This direct interaction resulted in good coordination of AgNPs over the CNF. The HRTEM image of the Ag@V-CNF-1 membrane (figure 2(C')) shows that AgNPs had a relatively uniform size of approximately 12 nm. However, when the amount of AgNO3 increased to 0.1 g (Ag@V-CNF-2), as can be seen in figures 2(D) and (D'), the intensity of the AgNPs along the CNFs increased but exhibited reduced size uniformity. This finding implies the possibility of applying this method when a higher loading of AgNPs is desired.
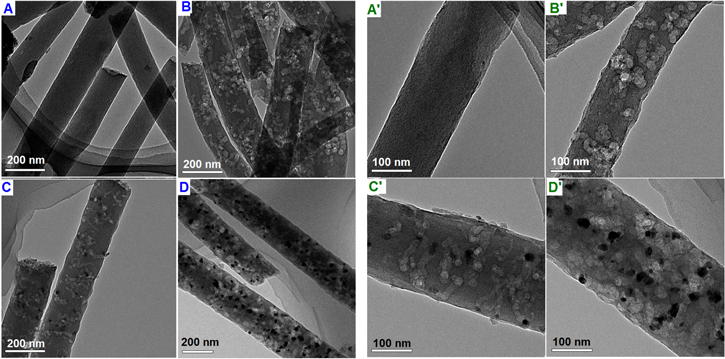
Figure 2. TEM images of (A) pure CNFs, (B) V-CNF, (C) Ag@V-CNF-1, (D) Ag@V-CNF-2; HRTEM images of (A') pure CNFs, (B') V-CNF, (C') Ag@V-CNF-1, and (D') Ag@V-CNF-2.
Download figure:
Standard image High-resolution imageThe Fourier-transform infrared (FTIR) spectra of V-CNF and Ag@V-CNF-1 membranes are presented in figure 3. The characteristic absorption peaks of V-CNF membrane are mainly in the range of 400 to 1000 cm−1. These absorption peaks include the symmetric and asymmetric stretching vibration peaks of the V-O band and the stretching vibration mode of the V-O band [33]. The intense bands around 1222 cm−1 and 671 cm−1 are characterized by the V=O stretching. The bands observed at 3308 cm−1 and 3448 cm−1 are attributed to the stretching and bending frequencies of adsorbed water. Moreover, the four characteristic peaks at 1114 cm−1, 1147 cm−1, 1358 cm−1, and 1550 cm−1 can be considered as C-H plane-bending vibration, which indicates a strong interaction between organic and inorganic materials. The same bands were also observed in the Ag@V-CNF-1 samples (figure 3). However, the V=O bands were weakened in intensity and exhibited broadened peaks, which imply a direct electrostatic interaction between Ag ions and the vanadyl group of VOχ, and resulted in the formation of V-O-Ag.
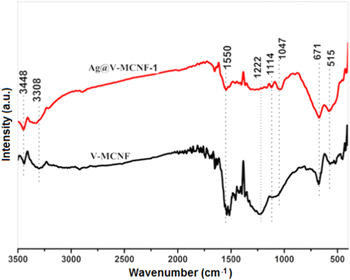
Figure 3. FTIR spectra of the samples of V-CNF membrane and Ag@V-CNF-1 membrane.
Download figure:
Standard image High-resolution imageFigure 4(A) shows the x-ray diffraction (XRD) patterns of pure CNFs, V-CNF, Ag@V-CNF-1, and Ag@V-CNF-2. The XRD pattern of the pure CNFs showing a graphite diffraction peaks at 25° and 43° corresponding to (002) and (101) planes, which indicate the presence of graphite-like carbon (curve (a) in figure 4(A)). However, the broad peaks and the complete absence of higher-order peaks in the XRD pattern suggest low graphitization and disordered amorphous structure for the prepared materials [34]. Curve (b) in figure 4(A) shows the XRD pattern of the V-CNF sample. No peaks attributed to vanadium oxides were detected, which indicates that the vanadium oxides were successfully incorporated into the crystal lattice of CNFs. This finding was confirmed by measuring the concentration of vanadium ions in the prepared samples using the inductively compled plasma atomic emission spectroscopy (ICP-AES). The value was found to be approximately 0.48%. In addition, the intensity of graphitic CNF peaks became weaker because of the destruction of graphitic layers during the decomposition of NH4VO3 by carbonization. Curve (c) in figure 4(A) shows the XRD pattern of the Ag@V-CNF-1 sample. All diffraction peaks were attributable to the AgNPs. The peaks located at 38.1°, 44.3°, 64.4°, 77.4°, and 81.5° (2θ) can be assigned to the 111, 200, 220, 311, and 222 diffractions of the fcc (face-centered cubic) structure of metallic silver, respectively [35]. Furthermore, the broadened diffraction peaks indicate the sizes of the AgNP crystallites are in the nanometer scale [36]. The diffraction peaks attributable to AgNPs became sharper when the amount of AgNO3 precursor increased to 0.1 g, which could be attributed to the stronger nucleation and less uniform size of AgNPs (curve (d) in figure 4(A)).

Figure 4. (A) XRD patterns of the samples of (a) pure CNFs, (b) V-CNF, (c) Ag@V-CNF-1, and (d) Ag@V-CNF-2. (B) UV–Vis diffuse-reflectance spectra of the same samples.
Download figure:
Standard image High-resolution imageThe UV–Vis spectra of pure CNFs, V-CNF, Ag@V-CNF-1, and Ag@V-CNF-2 membranes are shown in figure 4(B). The adsorption spectrum of pure CNFs shows no adsorption in the range of 200 to 800 nm. The absorption spectrum of V-CNF membrane displays a broad absorption range of 400 to 800 nm, which implies that more than one type of vanadium oxide species exist in the sample [37]. However, the absorption spectra of the Ag@V-CNF-1 and Ag@V-CNF-2 membranes show significantly higher light absorption in the visible region than that of V-CNF. In addition, new strong absorption peaks were recorded at 300 and 350 nm, which are attributed to the surface plasmon resonance (SPR) of AgNPs [38, 39]. This observation further substantiates the formation of AgNPs on the surface of VOx-embedded CNFs. As the SPR of AgNPs was excited by visible light, the photocatalytic property of VOx-embedded CNFs was distinctly enhanced. Therefore, the prepared photocatalyst may have high photocatalytic activity in the whole sunlight region.
The Brunauer-Emmet-Teller (BET) surface area and chemical decomposing of the prepared samples are presented in table 1. The BET surface areas of V-CNF, Ag@V-CNF-1, and Ag@V-CNF-2 were approximately 700 m2 g−1, which is remarkably higher than that of pure CNFs (200 m2 g−1). The reason for the higher surface areas is the generation of pores (>2 nm) by decomposition of the NH4VO3 dispersed on the surface and embedded into the carbon matrix during the carbonization as explained in our previous work [26]. The lower surface area of Ag@V-CNF-2 (680 m2 g−1) compared to Ag@V-CNF-1 (703 m2 g−1) might be attributed to the higher load of AgNPs covering larger sites of the surface of CNFs. The surface composition of the prepared materials was determined by x-ray photoelectron spectroscopy (XPS). All samples containing vanadium oxides had lower C content compared to the pure CNFs due to the decomposition of NH4VO3 in the carbon matrix and forming carbon monoxide and carbon dioxide during carbonization and generating the pores. However, their O content was higher compared to the pure CNFs, which is referred to the oxygen of vanadium oxides. The ratio of V atoms to Ag atoms on the surface of Ag@V-CNF-1 is almost 1:1. However, the Ag@V-CNF-2 sample has shown a ratio of 1:2 for V atoms to Ag atoms, which is in agreement with the XRD and UV–Vis results.
Table 1. BET surface area and XPS-determined surface composition.
| Composition on surface (atomic %) | |||||
|---|---|---|---|---|---|
| Sample | C | O | V | Ag | SBET (m2 g−1) |
| CNFs | 86.6 | 13.1 | — | — | 200 |
| V-CNF | 83.7 | 14.4 | 0.39 | — | 600 |
| Ag@V-CNF-1 | 83.4 | 14.5 | 0.47 | 0.48 | 703 |
| Ag@V-CNF-2 | 83.6 | 14.6 | 0.46 | 0.85 | 680 |
The XPS analysis was applied to further study the chemical and bonding environment of the prepared Ag@V-CNF-2 components, including the carbon phase, VOx, and AgNPs. Figure 5(A) shows the fully scanned spectrum of Ag@V-CNF-2 in the range of 0 eV to 1000 eV. The overview spectrum demonstrated that C, Ag, O, and V existed in the Ag@V-CNF-2 sample. The high-resolution XPS spectrum of the C1s region around 285 eV is shown in figure 5(B). The binding energy with a peak at 284.4 eV is attributed to C=C [40]. The peaks appeared at 286 eV and 289 eV are characteristic of the oxygen-bound species C–O and C=O [17, 29], respectively. The high-resolution XPS spectrum of the vanadium oxide is shown in figure 5(C). The binding energy at about 517.2 eV corresponds to the vanadium species in the oxidation state +5. The small peak showed at a lower binding energy (516.0 eV) can be attributed to vanadium species in a lower oxidation state, i.e., V4+ [41, 42]. Figure 5(D) shows the high-resolution XPS spectrum of Ag3d. The XPS curve can be well fitted by two peaks centered at 368.2 eV and 367.2 eV corresponding to Ag0 and Ag2O, respectively [43, 44]. Furthermore, in the process of Ag@V-CNF-2 membrane preparation, part of the AgNO3 that was used as the original reactant was reduced to Ag0 by thermal decomposition. The calculated surface mole ratio of metallic Ag0 to Ag2O is 1:0.59, which indicates that Ag mainly exists as Ag0 on the photocatalyst surface. These results are in good agreement with those of other research groups [43, 45].

Figure 5. (A) XPS fully scanned spectrum of the Ag@V-CNF-2; XPS spectrum of (B) C1s for the Ag@V-CNF-2, C) V2p for the Ag@V-CNF-2, and D) Ag3d for the Ag@V-CNF-2.
Download figure:
Standard image High-resolution image3.2. Water treatment in batch experiments
The photocatalytic activity and stability of the prepared V-CNF, Ag@V-CNF-1, and Ag@V-CNF-2 membranes were investigated by examining the organic pollutant MB under visible-light irradiation. Pure CNFs was used as control. The absorption spectra of the MB aqueous solution show the change of its concentration. As shown in figure 6(A), the control experiments were performed under different conditions: (1) in the presence of photocatalysts but in the dark and (2) with visible-light irradiation but in the absence of the photocatalysts. These results show that the adsorption-desorption equilibrium of MB in the dark was established within 30 min. Moreover, there was no significant degradation of MB after 1 h in the absence of photocatalysts. Figure 6(B) shows the degradation curves of MB over commercial VOx, pure CNFs, V-CNF, Ag-CNF, Ag@V-CNF-1, and Ag@V-CNF-2 under visible-light irradiation. As can be seen, negligible degradation efficiency was observed by adding VOx or pure CNFs for 10 min. However, in the presence of Ag-CNF (see the SEM and TEM images of Ag-CNF in the appendix) or V-CNF membrane, relatively rapid degradation was achieved, and the degradation efficiency of MB dye over the two membranes was approximately 23% and 30% after 10 min, respectively. In the case of Ag-CNF, the AgNPs was not evenly distributed on the surface of CNFs (figure A1 in the appendix) due to the absence of bending sites of vanadyl groups, and more importantly the mesoporous structure was not formed because of the absence of porogen, and thus the surface area was small as 218 m2 g−1. Therefore, the photocatalytic performance of Ag@V-CNF was higher than the Ag-CNF membrane. Notably, the Ag@V-CNF-1 and Ag@V-CNF-2 samples showed remarkably higher photocatalytic activity and achieved a complete degradation of MB dye after 7 and 9 min, respectively. The rate of MB dye decomposition was found to be in the order of Ag@V-CNF-2 > Ag@V-CNF-1 > V-CNF > Ag-CNF with values of 0.29 min−1, 0.22 min−1, 0.14 min−1, and 0.05 min−1, respectively. The Ag@V-CNF-2 composite exhibited excellent photocatalytic performance under visible-light irradiation due to (1) its good adsorptive capacity to dye molecules [46], (2) the smaller size of the Ag nanoparticles combined with higher moler ratio of metallic Ag0 to Ag+ [25], and (3) the facilitated charge transfer and suppressed recombination of electron–hole pairs in materials.

Figure 6. Degradation profiles of MB (A) in the presence of the pure CNFs and V-CNF, Ag-CNF, Ag@V-CNF-1, and Ag@V-CNF-2 but in the dark and with visible-light irradiation but in the absence of photocatalysts and (B) over different composite samples. (C) Four cycling experimental results of the Ag@V-CNF-2 photocatalyst. (D) The photodecomposition curve of MO and RhB over Ag@V-CNF-2 (30 mL of aqueous dye, 20 mg L−1, and 10 mg of the photocatalyst).
Download figure:
Standard image High-resolution imageThe stability of a photocatalyst is important for its application in environmental technology. Therefore, a four-cycle experiment of MB degradation over the Ag@V-CNF-2 membranes was conducted. As shown in figure 6(C), the photocatalytic-degradation efficiency of the novel membrane under visible-light irradiation remained high. Furthermore, in order to confirm the photodegradation efficiency and application feasibility of Ag@V-CNF-2, it was examined with MO and RhB dyes. As shown in figure 6(D), the Ag@V-CNF-2 membrane exhibited 100% decomposition of MO and RhB after exposure to visible light for 10 and 20 min, respectively. More importantly, the heteroarchitecture membranes with superior photocatalyst activity can be easily separated and recovered by sedimentation, which will significantly promote its practical application to eliminate organic pollutants from wastewater.
The bactericidal activities of the samples were evaluated based on the degradation of E. coli in water under visible-light irradiation. The reaction mixtures were taken at certain time intervals during the photodegradation process (every minute for 10 min). The concentration of E. coli was detected by the plate-count method. Pure CNFs membrane was used as a control in this experiment. Figures 7(A) and (B) clearly show that 99% of the bacteria had survived the existence of pure CNFs or V-CNF samples. These results reveal that pure CNFs or V-CNF with visible-light irradiation has no significant antibacterial effect on E. coli within 10 min. Notably, when employing Ag@V-CNF-1 or Ag@V-CNF-2 samples under visible-light irradiation, 100% of E. coli was killed within 5 min and 7 min, respectively. Note that the results of photocatalytic disinfection were in good agreement with the results of detoxification, which further confirms that the composite membrane has excellent photocatalytic capability and is more promising for practical application.

Figure 7. (A) Disinfection efficiency of E. coli by pure CNFs, V-CNF, Ag@V-CNF-1, and Ag@V-CNF-2 (60 ml of aqueous E. coli, initial bacteria concentration: 2.22 × 10⁹ CFU ml−1, 10 mg photocatalyst). (B) Digital images of the disinfection efficiency of E. coli.
Download figure:
Standard image High-resolution imageIn order to investigate the intrinsic chemical antibacterial strength of the Ag nanoparticles and to test the antibiofouling property of the prepared membranes, a standard Kirbye-Bauer approach (zone inhibition method) was applied. Samples of V-CNF, Ag@V-CNF-1, and Ag@V-CNF-2 membranes were placed on an E. coli inoculated agar plate and visualized for antibacterial activity after being incubated overnight. As shown in figure 8, Ag@V-CNF-1 and Ag@V-CNF-2 composites killed all the bacteria around them, and we observed distinct zones of inhibition (clear areas with no bacterial growth) around the two composite membranes in both light and dark environments. However, the disinfection was more effective in the light due to the photocatalytic effect. The observed inhibition zones around Ag@V-CNF-1 and Ag@V-CNF-2 membranes are a result of releasing active biocidal Ag+ ions from the silver nanoparticles presented in the membranes into the surrounding aqueous medium. Then, Ag+ reacts with the –SH groups of proteins and leads to the inactivation of those proteins that caused the bacterial death. These silver ions can be released again and combined with other proteins when the current protein is decomposed. Thus, these results also reveal the excellent antibiofouling property of the as-prepared Ag@V-CNF-1 and Ag@V-CNF-2 membranes. It is also important to note that the photodegradation capacity of Ag@V-CNF-2 is much higher than the reported results of 1D nanostructured photocatalysts [14, 18, 27, 32], which indicates the novel material is feasible for surface-water treatment.
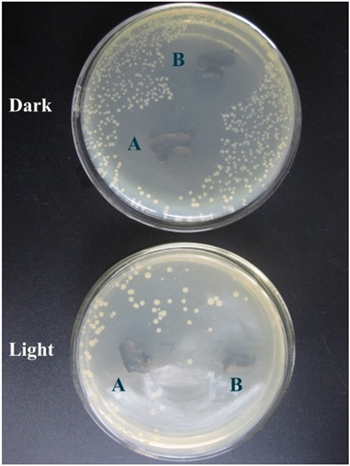
Figure 8. Photos of zone of inhibition test results. Comparison of the V-MCNF, Ag@V-MCNF-1, and Ag@V-MCNF-2 composite membranes.
Download figure:
Standard image High-resolution image3.3. Proposed mechanism
Based on the given experimental facts and analysis, we propose an explanation for the high photocatalytic performance observed from the V-CNF membrane. Recently reported results demonstrate that highly conductive long CNFs can efficiently capture and transport photogenerated electrons [47, 48]. Morever, CNF-supported catalysts are considered to exhibit cooperative or synergetic effects between CNFs and semiconductive metal oxides [18]. Here, a high-energy photon excites an electron from the valence band to the conduction band of VOx, photogenerated electrons in VOx may move freely towards the surface of CNFs, and excess valence band holes are left in the VOx to migrate to the surface and react with H2O or OH‾ to produce active species, such as OH• and O2• [49]. This finding suggests that the photogenerated electrons and holes were efficiently separated. Ag@V-CNF-2 had the best photo-degradation effect among all samples. A schematic model of the photocatalytic mechanism of Ag@V-CNF-2 membrane is presented in figure 9. AgNPs have been confirmed to make a significant contribution to the high visible-light photocatalytic activity as a result of the surface-plasmon resonance (SPR) produced by the collective oscillations of the surface electrons [9, 11]. The SPR of Ag, which is located at the visible-light region, results in the strong absorption of visible light. Ag exists in our Ag@V-CNF-2 in two forms, namely, Ag+ and Ag0, as revealed by the XPS analysis. Ag+ ions are easily reduced to Ag0 by electrons. Ag0 is the predominant Ag species on the surface of Ag@V-CNF-2, and it possesses abundant electron traps favorable for the separation of photoinduced electron–hole pairs, thus significantly enhancing visible photocatalytic activity [45, 50, 51]. Moreover, the h+ generated on AgNPs can oxidize the organic molecules directly [9, 52]. Notably, the photogenerated electrons in VOx may move freely toward AgNPs through the constructed channels in the CNFs matrix. These actions of electrons efficiently prevent hole and electron recombination. Therefore, the activity is retained at a high level, and more importantly, stability is ensured at the same time. The notably fast photodegradation performance is attributed to the unique mesostructure, which possesses a high surface area. This high surface area offers multiple interparticle scattering that increases the surface-adsorption capacity of reactants and enhances photocatalytic reactions.
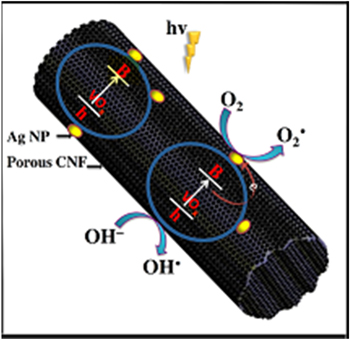
Figure 9. Schematic model of the photocatalytic mechanism of Ag@V-CNF-2 membrane.
Download figure:
Standard image High-resolution image4. Conclusions
In this work we described an effective route to synthesize a mesostructured vanadium oxide embedded carbon nanofiber membrane decorated with Ag nanoparticles (Ag@V-CNF-1 and Ag@V-CNF-2) by combining the electrospinning technique with carbonization based on a one-pot/self-template synthesis approach. Compared with undecorated vanadium oxide-CNF (V-CNF) and pure CNFs membrane, the Ag@V-CNF-2 membrane displayed excellent photocatalytic degradation performance of organic pollutants (MB, MO, and RhB dyes) and bacteria disinfection (E. coli) under visible-light irradiation. The membrane could be recycled easily and could maintain high efficiency even after four cycles due to its 1D nanostructure property. Thus, the membrane proved to be a promising candidate for eliminating organic pollutants from wastewater.
Acknowledgments
This work was supported by the Ministry of Science and Technology of China (Grant Nos. 2010DFA92820, 2010DFA92800, and 2012DFG91870) and China-American Cooperation for 10+10 (Grant No. 2010DFA91130). Special thanks to Dr. Anyuan Yin from the chemistry department at Fudan University for assisting in analyzing XPS data.
Appendix.
Appendix. A.1. Synthesis principle of Ag@V-CNF composite membranes
Inorganic ammonium metavanadate (NH4VO3) was used as a precursor because it is cost effective and more suitable for industrial production. NH4VO3 provides two critical contributions. First, it generates the mesoporous structure. When decomposed at a temperature of 200 °C to 280 °C, NH4VO3 produces intermediate vanadyl compounds species (e.g., (NH4)2V6O16 and NH4V4O10) before the formation of V2O5 at 450 °C [53]. Moreover, V2O5 has a melting point of 700 °C (2B1258, Junsei), which can be sufficiently dissociated by heat treatment as metal and oxygen at a higher temperature than the melting point of metal oxide. Dissociated oxygen in carbon fiber formats carbon monoxide and carbon dioxide during carbonization, generating the path between metal catalyst and pores over the structure. Second, the coordination of AgNPs on the CNF surface through the electrostatic direct connection of AgNPs and the vanadyl group of VOx, thus preventing AgNPs aggregation. PVP was selected as a copolymer with PAN for the following reasons: (1) the mixture of PVP and PAN reportedly performs as a phase-separated polymer during electrospinning, which can facilitate the decoration of CNFs with AgNPs [54]; (2) PVP improves the spinnability of the polymer mixture solution by reducing the viscosity, thus decreasing the diameter of the electrospun nanofibers.
Figure A1. (a) SEM image of Ag-CNF and (b) TEM image of Ag-CNF.
Download figure:
Standard image High-resolution image
Appendix. A.2. Characterization apparatus and measurements
The scanning electron microscopy (SEM XL30, Philips, The Netherlands) and transmission electron microscopy (TEM, HRTEM, JEM 2011, JEOL, Japan) were used to characterize the morphology of the products. X-ray diffraction (XRD) was carried out using an x-ray diffractometor (D/MAX-rB, Rigaku, Japan). UV–Vis spectroscopy (UV-2450, Shimadzu, Japan). X-ray photoelectron spectroscopy (XPS) was performed on a RBD upgraded PHI-5000C ESCA system (Perkin Elmer) with MgKα radiation (hν = 1253.6 eV). Fourier-transform infrared spectroscopy (FTIR) of KBr powder-compressed pellets was recorded on a Bruker Vector 22 spectrometer. Surface areas were calculated by the Brunauer–Emmett–Teller (BET) method. The concentrations of metal ions were measured by an inductively coupled plasma atomic emission spectrometer (ICP-AES), (Optima 2100 DV, Perkin Elmer, USA).
Appendix. A.3. Photocatalytic degradation tests
Photocatalytic decomposition of MB dye was performed in a beaker containing a suspension of 10 mg of the photocatalyst sample in 30 mL MB solution (20 mg L−1) under visible-light irradiation. The solution was stirred in the dark for 30 min to achieve good dispersion and to reach adsorption–desorption equilibrium between the organic molecules and the catalyst surface. The visible light was provided by a 300 W tungsten halogen lamp. The beaker was surrounded by ice and water to avoid the heating effect. At a given interval of illumination, samples of the reaction solution were taken out and analyzed using a Shimadzu UV/Vis (1700) spectrophotometer. The MB concentration (%) after various intervals of time can be estimated using the following equation:

where C0 is the initial MB absorbance at 566 nm and C is the absorbance obtained after various time intervals. The order of photocatalytic reaction is calculated by

where k(1/min) is the apparent reaction rate constant,  is the initial concentration of aqueous dye solution, and
  is the concentration of aqueous dye solution at reaction time t.
Appendix. A.4. Photocatalytic disinfection test
E. coli, the waterborne pathogen, was chosen as the model bacteria and was incubated in a lysogeny broth (LB) nutrient solution at 30 °C for 12 h with shaking. After washing and centrifugation at 4000 rpm, the growth was serially diluted to form a cell suspension in 0.9% saline to obtain 2.22 × 10⁹ colony-forming units (CFU/mL). The number of cells was determined by counting the colonies. An average number of cells was obtained by repeating the above procedure three times. To evaluate the performance of the photocatalysts, 10 mg of catalyst was mixed with 60 mL of the diluted bacterial suspension in a screw-capped flask. The photocatalytic reaction was carried out under the illumination of visible light from a 300 W tungsten halogen lamp and continuous stirring. At certain time intervals, 100 μl of the reaction mixture was collected and incubated at 37 °C for 12 h on a nutrient agar medium in the dark. All the photocatalytic experiments were performed in triplicate.
For the qualitative evaluation (zone of inhibition test), 20 ml of liquid nutrient agar was poured onto sterilized Petri dishes and allowed to solidify. Then 100 μl of the bacterial solution was streaked over the plate and spread uniformly. Both V-CNF and Ag@V-CNF membranes were gently placed over the solidified agar gel in different Petri dishes. The plates were incubated at 37 °C for 24 h under the visible-light illumination (the lamp was 30 cm above the dishes to avoid drought). The antagonistic activity was estimated by clear zone of inhibition around the examined membranes.
Figure A1(a) shows the SEM image of the Ag-CNF sample, which demonstrates a uniform nanofiber with a diameter of 250 to 300 nm. From the TEM image of the Ag-CNF presented in Figure A1(b), spherical black spots of AgNPs can be seen. However, the AgNPs disruption was not uniform, which implies the role of VOx in controlling their distribution along the CNFs.