

Abstract
Zinc oxide nanoparticles were prepared using corriandrum sativum leaf extract and zinc acetate dihydrate. It was utilized as a photocatalyst for the degradation of anthracene. The catalyst was characterized by x-ray diffraction, high-resolution transmission electron microscopy, scanning electron microscopy, dynamic scattering light, Raman spectrometry and UV–vis spectrophotometry. The catalyst was used in a bench-scale design for degradation of anthracene. The factors affecting the photocatalytic degradation efficiency, including irradiation time, loading catalyst doses, and initial concentration of anthracene were investigated. The results obtained showed that the photocatalytic degradation efficiency was increased with both the decrease of the initial anthracene concentration and the increase of the photocatalyst doses. The optimum photocatalytic degradation was obtained at pH 7, irradiation time of 240 min and loading catalyst dose of 1000 μg L−1. Under these conditions, the photocatalytic degradation percentage of anthracene was 96%. The byproduct was the much less toxic (9, 10-anthraquinone) and a small amount of phthalic acid as confirmed by gas mass spectrometry and high-pressure liquid chromatography. The kinetic studies revealed that the photocatalytic degradation process obeyed the Langmuir–Hinshelwood model and followed a pseudo-first-order rate expression.
Export citation and abstract BibTeX RIS

Original content from this work may be used under the terms of the Creative Commons Attribution 3.0 licence. Any further distribution of this work must maintain attribution to the author(s) and the title of the work, journal citation and DOI.
1. Introduction
Anthracene is commonly used in the production of artificial dyes, insecticides and coating materials. It is also known by its high toxicity of biological tissues. When anthracene enters the body, it directly harms the skin, stomach, intestines and the lymphatic system, and probably induces some tumors [1]. Because of low molecular weight, compared to most of the other polyaromatic hydrocarbons (PAHs) and other organic pollutants [2], anthracene has a higher solubility in aqueous solutions and can be found at more significant levels in water. It represents a high concern to the environment [3]. It is listed as a priority hazardous substance in the European Union and the United States Environmental Protection Agency pollutants list [3, 4]. Due to its structural similarity to the high molecular weight carcinogenic (PAHs) [5], it is usually used as an important model compound for the degradation studies of these compounds [4, 6].
The literature survey shows that the most recent studies of anthracene degradation have been conducted using bio-degradation methods. Aspergillus fumigates [7], white rot fungus phanerochaete chrysosporium immobilized on sugarcane bagasse [8], fusarium solani strains isolated from mangrove sediments, immobilized peroxidase from momordica charantia [9], immobilized enzyme [10], have been used. Most of these methods, however, have poor efficiency, require several days for degradation and involve time consuming manipulation steps and unavailable biological catalysts. Comparison between many of those previously published methods and the present study are summarized in table 1.
Table 1. Some degradation methods suggested for degradation of anthracene.
| Type of degradation | Material used | Degradation efficiency | Time of degradation | End product | References |
|---|---|---|---|---|---|
| Biodegradation | Aspergillus fumigatus | 60% | after 5 days | phthalic acid | [7] |
| Enzymatic degradation | Ligninolytic enzyme manganese peroxidase produced by phanerochaete chrysosporium | 74% | 7 days incubation | — | [8] |
| Biodegradation | Fusarium solani strains isolated from mangrove sediments | 40% | after 40 days of incubation | phthalic acid | [9] |
| Enzymatic degradation | immobilized peroxidase enzyme | more than 40% in spiral-bed reactor | 1 month | — | [10] |
| Enzymatic degradation | Ligninolytic enzyme manganese peroxidase | around 100% | 6 h | — | [11] |
| Biodegradation | Escherichia coli (EF105548), soil bacterium (EF105549), Alcaligenes sp.(EF105546) and Thiobacter subterraneus (EF105547) | 28.57, 30.19, 26.5875 and 32.11% | — | — | [12] |
| Biodegradation | Bacillus circulans SBA12, Kurthia SBA4 | 87.5% and 86.6% | after 6 days of incubation | — | [13] |
| Biodegradation | Pseudomonas sp. | 74.8% | 10 days | — | [14] |
| Biodegradation | Bacillus sp. | 79.482% | — | — | [15] |
| Biodegradation | chemically modified laccase | 97% | 72 h | — | [16] |
| Biodegradation | a novel strain Brachybacterium paraconglomeratum | 70% | 10 days | — | [17] |
| Biodegradation | Corynebacterium sp and Pseudomonas putida | 95.2%, 93.5 w/w% | for 96 h | — | [18] |
| Photocatalytic degradation | Titanium dioxide | — | — | 9 to 10 anthraquinone | [19] |
| Photocatalytic degradation | Titanium dioxide | — | 24 h | 1, 2-Benzenedicarboxaldehyde and 9, 10-anthracenedione | [20] |
| Photocatalytic degradation | ZnO nanoparticles | 96% | 4 h | 9, 10-anthraquinone and phthalic acid | This work |
Heterogeneous photocatalytic using photocatalysis materials with high efficiency and low cost was considered as one of the effective futuristic water purification methods. Once these photocatalysis materials have been developed, heterogeneous photocatalytic can be applied for high-throughput systems in environment protection. Until now, TiO2 and ZnO are most widely studied photo-catalysts, both as semiconductors (SCs) have the similar band gaps (3.2 and 3.3 eV). Moreover, ZnO has shown higher quantum efficiency [21], because it absorbs more quantum of light in the UV region compared with TiO2 [22]. Moreover, ZnO is known as an important photocatalyst due to its unique advantages, such as the simple and cheap fabrication materials, the high photocatalytic activity, the non-toxicity, and the high photosensitivity and stability. Using SCs photocatalysts for the removal of organic pollutants in wastewater has attracted a lot of attention as an important issue on environmental protection.
Throughout the development of nanoscience and nanotechnology, many research reports have been focused on the application of nanocatalyst materials. Nanomaterials have a higher specific surface area appropriate for catalysis, and are synthesized with controllable sizes and morphologies which affect the catalytic activity. However, the photocatalytic properties of ZnO nanoparticles in the degradation of pollutants are directly related to their synthesis, e.g. particle size, morphology and dopant concentrations. It has been noticed that the surface characteristics of ZnO are determined by the different synthesis processes and this influence the photocatalytic property and the final degradation efficiency [23].
Although, physical and chemical methods are prevalent in nanoparticles synthesis, the green synthesis is the best improvement due to the protection of the environment as well as the synthesized nanoparticles with small size and large surface area. The plant phytochemicals with antioxidant properties is responsible for the synthesis of metal and metal oxide nanoparticles. This benign reaction is quite rapid, readily conducted at room temperature and pressure, and easily scaled up. Laterally, synthesis of nanoparticles has been accomplished by bacteria, fungi, actinomycetes [24]. Moreover, the use of the extract of neem, camellia Sinensis, corriandrum, nelumbolicifera, ocimum sanctum and many other plants comply with the principles of green chemistry and is environmentally benign [25].
Mechanism of photocatalytic oxidation is shown as follows. The photocatalytic oxidation reaction initiated when a photogenerated excited electron transferred from the filled valence band of the photocatalyst to the empty conduction band as the absorbed photon energy, hν, equals or exceeds the band gap of the photocatalyst. The photogenerated electrons and holes have been found to degrade many types of organic and inorganic pollutants [26]. It is possible to suggest that the electron–hole pair (e−−h+) is generated at the surface of ZnO NP's photocatalyst through possible reactions leading to the formation of reactive oxidative hydroxide radicals through catalytic photo-oxidation using ZnO NP's as follows:


It has been reported that the hydroxyl radical (•OH) is a powerful oxidant for the degradation of many organic compounds [27]. Figures 1 and 2 illustrate the possible pathway of the degradation process of anthracene byproducts by the effect of the hydroxyl radical (•OH) [28].
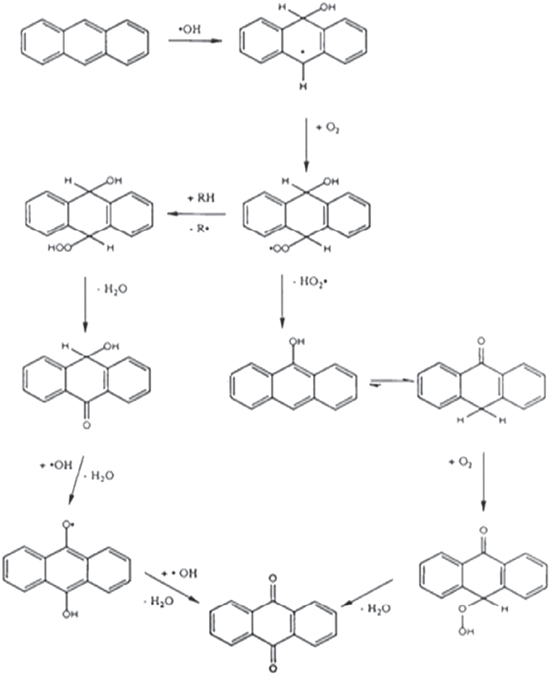
Figure 1. Pathway of the degradation process of anthracene to 9, 10 anthraquinone.
Download figure:
Standard image High-resolution image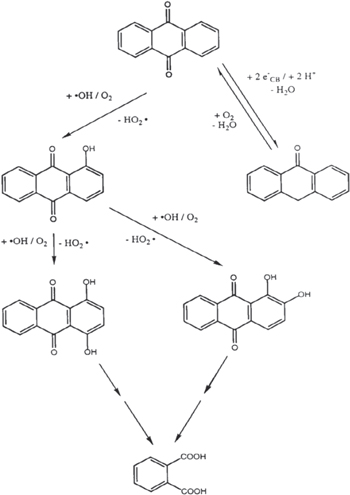
Figure 2. Pathway of the degradation process of 9, 10 anthraquinone to phthalic acid.
Download figure:
Standard image High-resolution imageThe present work deals with the preparation of ZnO nanoparticles using an aqueous leaf extract of corriandrum sativum, characterization and application in the presence of UV radiation for photocatalytic degradation of anthracene. The effects of various operating degradation conditions and the kinetics of the reaction based on Langmuir-Hinshelwood model are described [29].
2. Materials and methods
2.1. Equipment
The crystalline phase of ZnO powders was analyzed by x-ray diffraction (XRD) X'Pert Pro-PANlytical. The operation conditions at 40 kV and 40 mA were used with CuKα (λ = 1.54 Ao) and 2θ ranging from 4 to 80°. The microstructure morphology of ZnO was obtained by scanning electron microscopy (SEM) JSM-5300. The particle sizes of ZnO nanopowder were detected by dynamic scattering light (DLS) Zetasizer Nano-ZS, Malvern, Instruments, UK, at 633 nm (laser source He-Ne) and high-resolution transmission electron microscopy (HR-TEM) JEM-2100, JEOL. The elemental spectrum of ZnO nanoparticles was gained by energy dispersive x-ray spectroscopy (EDX) JEM-2100, JEOL. The optical properties of the prepared ZnO nanoparticles were characterized by UV–vis spectrophotometry using JENWAY 6505 spectrometer. Raman spectra were taken using Bruker senterra dispersive Raman system with 532 nm laser line.
For gas chromatography–mass spectrometry (GC–MS) analysis, Varian cp-3800 instrument equipped with DB5-m's column (30 m × 0.32 mm) was used for detecting the final degradation products of anthracene. The column film thickness was 0.25 μm, thermal program was started from 40 °C (4 min, 4 °C min−1) to 280 °C (5 min) using helium gas as a carrier. Injector with split ratio of 40, temperature 250 °C and a mass spectrometer detector (Varian 1200L) were used. The mass range was 50–450 (full scan), the ion source was EI (70 eV) and the sample size was 0.5 μl. At the end of the photocatalytic reaction and after the removal of the photocatalyst by filtration, the filtrate was extracted three times with 5 ml of doubly distilled chloroform (Sigma-Aldrich). The extract was collected and subsequently evaporated to less than 1% of the original volume and 10 μl was injected into the GC–MS to identify the degradation products of anthracene.
High pressure liquid chromatograph (HPLC, Agilent 1200 series) with a 5 μm × 25.0 cm × 4.6 mm LC-C18 column and equipped with PDA detector and auto-sampler was used to follow up the degradation reaction. The mobile phase consisted of 40% water and 60% acetonitrile. The solvent program was isocratic, the flow rate was 1.0 ml min−1 and the injection volume was 5 μl.
2.2. Reagents
All reagents used were of high purity grade and doubly distilled, deionized water was used throughout. Zinc acetate dihydrate (99% purity), anthracene 99% analytical grade, and sodium hydroxide (pellet 99%) were purchased from Sigma-Aldrich (St. Louis, MO). The corriandrum sativum plant was obtained from local grocery shops.
2.3. Experimental
2.3.1. Preparation of corriandrum sativum leaf extract
Freshly corriandrum sativum leaves were collected, shredded, washed several times with water to remove the dust particles followed by deionized water and air dried at 50 °C for 30 min to remove the residual moisture. The plant extract was prepared by weighting 50 g of the washed, dried leaves in 500 ml glass beaker followed by the addition of 200 ml of deionizer water. The mixture was boiled until the color of the aqueous solution changes to dark yellow. The extract was cooled to room temperature and filtered using Whatman (No 40) filter paper.
2.3.2. Qualitative phytochemical analysis of corriandrum sativum leaf extract
The extract was subjected to qualitative tests for the identification of various phytochemical constituents using the standard procedures [30]. The results showed the presence of some phytochemicals, which are responsible for the synthesis of metal oxide nanoparticles such as alkaloids, flavonoids, carbohydrates, glycosides, steroids and tannins. Fixed oils, proteins, terpenoids, and saponines were not detected.
2.3.3. Preparation of zinc oxide nanoparticles by green syntheses
To 50 ml of distilled water, a 0.2 g portion of zinc acetate dihydrate was added under vigorous stirring for 10 min. A 1.0 ml aqueous corriandrum sativum leaf extract was added to the above solution followed by the addition of 2.0 M NaOH drop wise until the pH became 12 and a pale white aqueous solution was obtained. The mixture was stirred for 2 h. The obtained pale white precipitate was isolated, washed several times with distilled water, followed by ethanol and dried at 60 °C under vacuum over night. The pale white powder of ZnO nanoparticles was carefully collected and used for further investigation.
ZnO nanoparticles also prepared without using of the extract as a plank, a 0.2 g portion of zinc acetate dihydrate was mixed with 50 ml of distilled water. The mixture was vigorously stirred for 2 h and a 2.0 M NaOH solution was added drop wise to reach pH 12. The white precipitate formed was filtered off, washed thoroughly with distilled water, followed by ethanol and dried at 60 °C under vacuum oven overnight.
2.4. Photocatalytic degradation reaction of anthracene
The photocatalytic degradation of anthracene, using green synthesized ZnO nanoparticles (prepared using corriandrum sativum extract), was investigated by using a batch photocatalytic reactor. A mixture of ZnO and anthracene suspension was sonicated in an ultrasonic bath for 20 min before irradiation at 368 nm by 2 UV lamps, 20 W each. The light source was fixed at a distance of 10 cm from the surface of the reaction vessel and the radiation source was placed on the middle of the photoreactor. The reaction mixture was irradiated at 368 nm with continuous stirring. After each run, the photocatalyst was separated from the anthracene solution by centrifugation at 4000 rpm.
To study the effect of some parameters such as pH, irradiation time, initial concentration and photocatalyst dose on the anthracene degradation, batch experiments were conducted for each parameter. Anthracene solutions in acetone with various initial concentrations (25, 50, 75 and 100 μg L−1) were prepared. Each of these solutions was mixed with various concentrations of ZnO nano particles (250, 500, 750, 1000 and 1250 μg L−1). The pH of the mixtures was adjusted at pH 5, 7, and 9 using aqueous 2 M solution of HCl or NaOH. The irradiation time interval was from 10 to 360 min.
A series of batch experiments were conducted under the optimum condition of photoccatalytic degradation in terms of concentration of ZnO NP's, temperature, pH values, and irradiation time as follows:
- (1)Anthracene aqueous solution 25 μg L−1 concentration was irradiated by using of UV light in the absence of ZnO at pH 7, temperature 25 °C and irradiation time 240 min.
- (2)Anthracene aqueous solution 25 μg L−1 concentration allowed to contact with 1000 μg L−1 green synthesized ZnO catalyst in dark at pH 7, temperature 25 °C and 240 min of continuous stirring.
- (3)Anthracene aqueous solution 25 μg L−1 concentration, allowed to contact with 1000 μg L−1 chemically synthesized ZnO catalyst (prepared without using corriandrum sativum extract) in dark with continuous stirring at pH 7, temperature 25 °C and 240 min of continuous stirring.
- (4)Anthracene aqueous solution 25 μg L−1 concentration allowed to contact with 1000 μg L−1 chemically ZnO catalyst at pH 7, temperature 25 °C and irradiation time 240 min.
3. Results and discussion
3.1. Characteristics of ZnO nanoparticles
The XRD pattern of the green synthesized ZnO nanoparticles obtained from zinc acetate dihydrate and aqueous extract of corriandrum sativum leaf is illustrated in figure 3(a). The peaks obtained show that the powder is highly crystalline, and all peaks are in good agreement with the hexagonal structure of the reference pattern: ZnO, 04-016-6648. High purity and crystalinity of the prepared ZnO NPs are revealed by the appearance of a clear, sharp peak and the absence of peaks from other phases of zinc oxide and impurities.

Figure 3. XRD spectra of (a) green and (b) chemically synthesized ZnO nanoparticles.
Download figure:
Standard image High-resolution imageThe XRD pattern of the chemically synthesized ZnO NPs obtained from zinc acetate dihydrate and NaOH is shown in figure 3(b). The structure of this compound does not agree with the hexagonal structure of the reference pattern of ZnO, 04-016-6648. Peaks due to the presence of Zn (OH)2 are also displayed.
DLS measurements for a size distribution profile of green synthesized ZnO NPs (figure 4(a)) reveals a maximum intensity at the average particle size of 52 nm. On the other hand, chemically synthesized zinc oxide shows an intensity for particles at an average size of 253 nm (figure 4(b)). These results confirm the presence of phytochemical compounds from the extract preventing particle agglomeration.

Figure 4. DLS size distribution of (a) green and (b) chemically synthesized ZnO nanoparticles.
Download figure:
Standard image High-resolution imageHR-TEM analysis (figure 5(a)) shows that the green synthesized ZnO NPs are in the particle size range from 9 nm to 18 nm. The HR-TEM images demonstrate the internal structure and give a more accurate detection of particle sizes. Figure 5(b) shows that the particle size of chemically synthesized zinc oxide nanoparticales ranges from 190 nm to 210 nm.
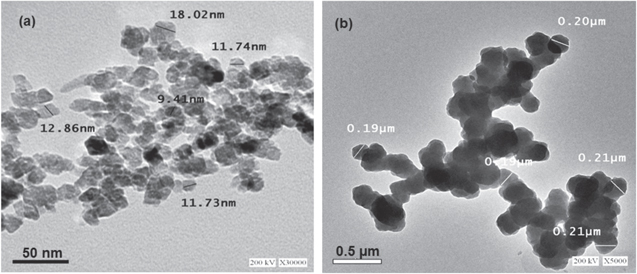
Figure 5. HR-TEM image of (a) green and (b) chemically synthesized ZnO nanoparticles.
Download figure:
Standard image High-resolution imageSEM image of ZnO NPs (figure 6) shows the external morphology of the nanoparticles.
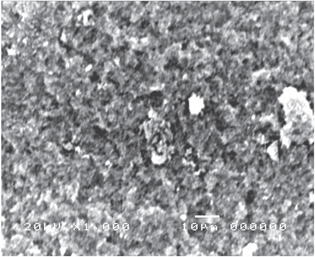
Figure 6. SEM image of ZnO nanoparticles prepared by the green synthesis method.
Download figure:
Standard image High-resolution imageEDX measurement result of the green synthesized ZnO nanoparticles is shown in figure 7. The peaks of zinc and oxygen elements are in the ratio of 1:1 confirming the formation of pure ZnO NPs.
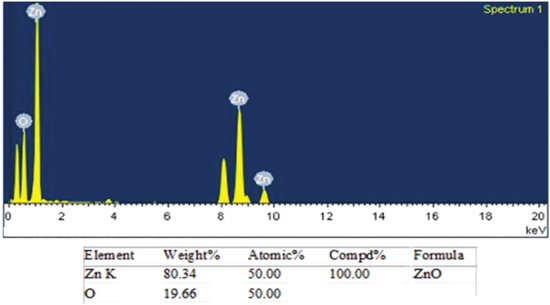
Figure 7. SEM image of green synthesized ZnO nanoparticles.
Download figure:
Standard image High-resolution imageThe optical properties of green synthesized ZnO nanoparticles measured by UV–vis spectrometry (figure 8) show an intense absorption band at 340–390 nm. It is known that ZnO displays a maximum absorption band at about 368 nm [31].
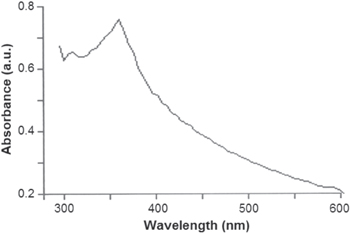
Figure 8. UV–vis spectrum of green synthesized ZnO nanoparticles.
Download figure:
Standard image High-resolution imageThe Raman spectrum of ZnO NPs in the range of 200–1400 cm−1 (figure 9) shows a strong E2 mode of vibration at 438.5 cm−1 confirming the presence of ZnO nanoparticles [32].
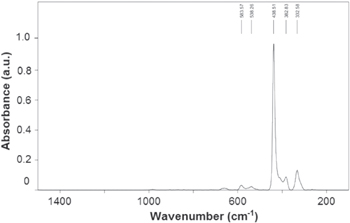
Figure 9. Raman spectrum of green synthesized ZnO nanoparticles.
Download figure:
Standard image High-resolution image3.2. Factors affecting the photocatalytic degradation of anthracene
3.2.1. Effect of irradiation time
The effect of irradiation time on the efficiency of anthracene photocatalytic degradation was tested at time intervals ranging from 10 to 360 min under UV light, using 1000 μg L−1 of ZnO catalyst and 100 μg L−1 of aqueous anthracene solution at pH 7 and at 25 °C. The results obtained (figure 10) indicated that the photocatalytic degradation efficiency increases with the increase of the illumination time. The percentage of anthracene photocatalytic degradation is increased to 88% by increase the irradiation time up to 240 min. Increasing the irradiation time to above 240 min, causes a decrease in the degradation percentage of anthracene, probably due to the presence of a large amount of the intermediates and byproducts produced by the photocatalytic degradation. These small organic molecules are adsorbed on the surface of green synthesized ZnO and compete with the large molecules of anthracene leading to a decrease in the amount of •OH radicals. In addition, the further increases of irradiation time, produces a greater amount of free radicals and leads to more crowding and recombination between the free radicals which decrease the percentage of degradation.

Figure 10. Effect of irradiation time on the photocatalytic degradation of anthracene (at pH 7, anthracene of 100 μg L−1 and ZnO of 1000 μg L−1).
Download figure:
Standard image High-resolution image3.2.2. Effect of pH
By allowing anthracene aqueous solution (100 μg L−1) to contact with green synthesized ZnO NPs catalyst 1000 μg L−1 at different pH 5, 7 and 9 under irradiation time from 10 to 360 min, the result obtained show that the highest efficiency was obtained at pH 7.
3.2.3. Effect of temperature
The effect of temperature on the rate of anthracene degradation using green synthesized ZnO NPs was studied over the temperature range of 25–40 °C. The efficiency of degradation values indicates that increasing temperature causes a slight increase in the reaction rate. Unlike thermal catalytic reactions, photocatalytic degradation reactions are known to be insensitive to temperature change [33]. The little enhancement of photocatalytic degradation by increasing temperature is probably due to the increase of collision frequency of molecules. Irradiation is believed to be the primary source of electron–hole pairs at ambient temperature because the band gap Eg is too high to overcome by thermal excitation [34]. Photocatalytic degradation reactions, using high band gap SC catalysts, normally have rates that are known to be independent of temperature [35]. The energy provided by heating is relatively small; heating to 40 °C (313 K) provides only a fraction of an electron volt, which is far less than that needed to excite the high-band gap of ZnO. Moreover, at higher temperatures, contaminant molecules may become more desorbed away from catalyst surface, which lowers the reaction rate [36]. Higher temperatures are also responsible for removal of oxygen from the reaction mixture which is necessary for the contaminant oxidation [37].
3.2.4. Effect of ZnO catalyst dose
The effect of ZnO catalyst dose on the efficiency of anthracene photocatalytic degradation was detected by using various amounts of the green synthesized ZnO NPs (250, 500, 750, 1000 and 1250 μg L−1) and 100 μg L−1 aqueous anthracene solution in a total volume of 100 ml. The pH of the solution was kept at 7, the temperature at 25 °C and the UV irradiation time interval ranged from 10 to 240 min. A maximum photocatalytic degradation efficiency (89%) was obtained with 1000 μg L−1 ZnO photocatalyst. The results obtained (figure 11) show that the degradation efficiency increases by increasing the photocatalyst dose up to 1000 μg L−1. This is due to the increase in the number of active sites on the catalyst surface, causing an increase in the number of absorbed photons, which leads to production of large number of •OH radicals, and increase degradation of anthracene molecules. By increasing the catalyst dose greater than 1000 μg L−1 the solution become turbid, thus, decreasing the effectiveness of the catalyst activation during the UV irradiation.

Figure 11. Effect of catalyst concentration on photocatalytic degradation of anthracene at pH = 7 and different concentrations of ZnO.
Download figure:
Standard image High-resolution image3.2.5. Effect of initial concentration of anthracene
The effect of initial concentration of anthracene on its photocatalytic degradation percentage was studied by using different initial concentrations of anthracene (25–100 μg L−1) and 1000 μg L−1 of ZnO catalyst at pH 7 and 25 °C under irradiation time intervals of 10 to 240 min. The results obtained (figure 12) show that the degradation percentage slightly decreases with increasing the initial concentration of anthracene. Degradation percentages of about 96%, 94%, 92% and 88% are obtained with 25, 50, 75 and 100 μg L−1 of anthracene, respectively after 240 min of irradiation. The slight decrease in the degradation percentage with the increase of the initial concentration of anthracene is probably due to the adsorption of anthracene on the surface of the catalyst leaving fewer active sites for adsorption of HO− and consequently reduces the generation of HO•.
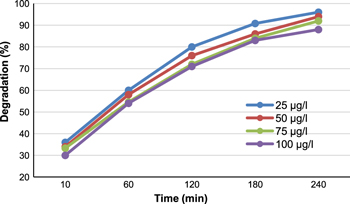
Figure 12. Effect of initial concentration of anthracene on the photocatalytic degradation under UV irradiation.
Download figure:
Standard image High-resolution imageFurthermore, as the concentration of anthracene increases with constant intensity of light illumination, the number of photons entering the solution decreases, so only fewer photons reached the catalyst surface. As a result, the productions of holes or hydroxyl radicals that can attack anthracene are limited. Therefore, the relative availability of HO• ready to attack the anthracene compound decreases and thus the photo-degradation percentage decreases. Also, when the initial concentration of anthracene is high, it will inhibit the photocatalytic degradation due to the interception of the photons before reaching the catalyst surface. However, with dilute anthracene solutions, an increase in the incidental photonic flux of catalyst irradiation causes an increase in the rate of hydroxyl radical (•OH) production and accelerates the degradation process.
3.3. Photolysis and adsorption of anthracene
The results obtained (figure 13) show that photolysis under UV irradiation (in the absence of ZnO catalyst) gives low degradation efficiency (about 22% after 240 min). The presence of green synthesized ZnO NPs without irradiation gives a decrease of anthracene concentration by about 60% within 240 min. Chemically synthesized ZnO NPs without irradiation gives lower efficiency for anthracene adsorption (about 25% in 240 min) compared with 60% obtained by using green synthesized ZnO.

Figure 13. Comparison between different techniques used for removal of 25 μg L−1 anthracene: Photocatalytic degrad ation by using 1000 μg L−1 of ZnO [1] (green synthesized) and ZnO [2] (chemically synthesized). Adsorption by using 1000 μg L-1 of ZnO [1] (green synthesized) and ZnO [2] (chemically synthesized). Photolysis by using UV lamp only.
Download figure:
Standard image High-resolution imageIrradiation of anthracene with UV light in the presence of chemically synthesized ZnO NPs catalyst under the same conditions gives lower degradation efficiency (31% in 240 min), compared with a green synthesized ZnO NPs catalyst which caused high decrease of anthracene concentration (96% in 240 min) due to photocatalytic degradation.
3.4. Kinetic study of photocatalytic degradation
The kinetic study of the photocatalytic degradation of anthracene using green synthesized ZnO was investigated with the Langmuir–Hinshelwood kinetic model, which also covers the adsorption properties of the substrate on the photocatalyst surface [29]. The equation is represented as follows:

where C is the concentration of anthracene at the irradiation time, k the reaction rate constant, and K is the degradation coefficient of the reactant.
By the integration of this equation (with initial condition C = C0 for t = 0), we obtain first-order expression:

where k' is the apparent rate constant. A plot of ln (C0/C) versus time results in a straight line; its slope is the pseudo-first-order degradation rate constant (Kapp).
The experimental data obtained in the kinetic study of anthracene degradation at different concentrations were fitted with the Langmuir–Hinshelwood kinetic model. The results obtained are illustrated in figure 14.
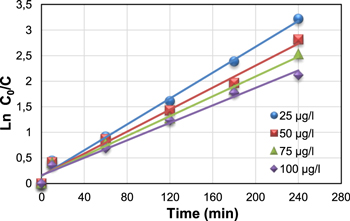
Figure 14. Kinetic study of the photocatalytic degradation at different concentrations of anthracene with green synthesized ZnO nanoparticles (concentration of ZnO 1000 μg L−1, pH 7).
Download figure:
Standard image High-resolution imageThe plots of the concentration data give a straight line, showing that the photocatalytic degradation of anthracene can be described by the pseudo-first-order kinetic model. The correlation coefficient constant for the fitted line and the rate constants are graphically obtained and their values for each concentration are represented in table 2.
Table 2. Rate constants of the photocatalytic degradation of anthracene.
| No | ZnO concentration (μg L−1) | Initial concentration of anthracene solutions (μg L−1) | Kapp | R2 |
|---|---|---|---|---|
| 1 | 1000 | 25 | 0.013 | 0.992 |
| 2 | 1000 | 50 | 0.011 | 0.986 |
| 3 | 1000 | 75 | 0.010 | 0.987 |
| 4 | 1000 | 100 | 0.009 | 0.984 |
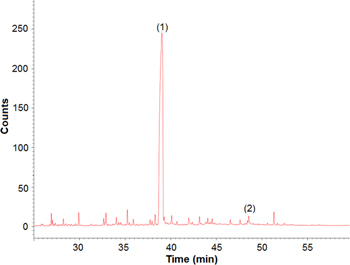
3.5. Identification of the byproduct of anthracene photocatalytic degradation
The byproducts of the photocatalytic degradation of anthracene with ZnO NPs photocatalyst after 6 h of irradiation were isolated by extraction with chloroform and identified using GC–MS. The chromatogram (figure 15) displays a main strong peak of 9, 10-anthraquinone, besides minor peak of phthalic acid.
Figure 15. GC–MS chromatogram of the degradation products of anthracene using green synthesized ZnO nanoparticles where a major peak of 9, 10-anthraquinone [1] and traces of phthalic acid [2].
Download figure:
Standard image High-resolution image
It is well documented that anthraquinone is much less toxic than anthracene [38]. It has been reported that the acute oral LD50 of anthraquinone in rats is >5000 mg kg−1 and the acute dermal LD50 in rabbits is >5000 mg kg−1, non-toxic to bluegill sunfish and rainbow trout, and non-toxic to freshwater daphnids, compared with the toxicity of anthracene LD50 in intraperitoneal mouse is 430 mg kg−1 and LD50 rat dermal >1320 mg kg w−1, toxicity to fish LC50 for lepomis macrochirus (bluegill) is 0.001 mg l−1 in 96 h, EC50 for daphnia magna (water flea) is 0.1 μg L−1 in 48 h [39]. The ecotoxicity of phthalic acid on fish have been cited in the ECOTOX database as, acute toxicity to fish LC50 (48 h) >1000 000 μg L−1 [40].
4. Conclusions
Zinc oxide nanoparticles was prepared using the extract of corriandrum sativum leaf, characterized and utilized as an effective photocatalyst for anthracene degradation.. Instrumental methods (XRD, SEM, HR-TEM, DLS, Raman, UV–Vis) reveal and confirm the formation of nanoparticles of sizes in the range of 9–18 nm. Optimum photocatalytic degradation of 100 μg L−1 anthracene is 1000 μg L−1 ZnO NP's, at ambient temperature (25 °C), pH 7 and ultraviolet irradiation for 240 min. Under these conditions the percentage decomposition of anthracene is ∼96%. The kinetic study of the reaction obeys Langmuir–Hinshelwood model and fitted the pseudo first order rate constants. Formation of anthraquinone as a main decomposition product was confirmed by HPLC and gas–mass-spectrometry. This photocatalytic degradation reaction significantly reduces the toxicity of anthracene.
It is concluded that the photocatalytic degradation of anthracene with ZnO NP's prepared using the extract of corriandrum sativum plant is an effective method in terms of simplicity, degradation efficiency and time of degradation.