

Abstract
Bulk superconductor samples of YBa2Cu3O7−δ (YBCO) doped with nano metal oxides of Mn3O4, Co3O4, Cr2O3, CuO and SnO2 respectively with 0.2 wt% are synthesized by a solid-state reaction route. The structural characterization of all samples has been carried out by x-ray diffraction (XRD) and scanning electron microscopy (SEM) and transmission electron microscopy (TEM) techniques. The XRD patterns indicate that the magnetic doping of nano metal oxides  gives a high value of orthorhombicity of the YBCO samples which is the result of high oxygen content, and consequently could give better superconducting properties contrary to the non magnetic nano oxides (CuO, SnO2). The critical temperature (Tc) of the studied samples was found to improve by nano magnetic doping and lower with nano nonmagnetic doping. The superconducting transition temperature Tc determined from electrical resistivity measurements was found to increase for Mn3O4 (5.27 μB) doping and decrease for other metal oxides doping.
Export citation and abstract BibTeX RIS

Original content from this work may be used under the terms of the Creative Commons Attribution 3.0 licence. Any further distribution of this work must maintain attribution to the author(s) and the title of the work, journal citation and DOI.
1. Introduction
From the discovery of the YBa2Cu3O7−δ (YBCO) compound, various elements have been added in the YBCO system to increase its critical temperature (Tc) and critical current density (Jc). In various bulk copper oxide superconductors including YBCO, the grain boundaries play a crucial role in deciding their superconducting performance [1–4]. There is an effective way to improve the infield performance of coated conductors by introducing various kinds of pinning centers using a variety of techniques, including interlayers of nonsuperconducting materials, mixed rare-earth doping and doping with self-aligned BaZrO3 nanodots and nanorods, as well as the use of nanoparticle-modified substrate surfaces [5–12]. For practical applications of superconducting materials in applied magnetic fields, artificial pinning centers in addition to natural ones are required to oppose the Lorentz force. These pinning centers are actually various types of defects in the superconductor matrix. Pinning centers can be categorized on their dimension (volume, surface, or point) and on their character [13]. Flux pinning is desirable in high temperature ceramic superconductors to prevent 'flux creep' which can create a pseudo-resistance and depress both critical current density and critical field. Degradation of high temperature superconductor properties due to flux creep is a limiting factor in the use of these superconductors [14]. The pinning properties in superconductors is usually investigated by the determination of the volume pinning forces, which is mainly affected by the pinning center size because the pinning center size determines the total length of interacting flux lines and the geometrical nature of the interaction. The magnetic flux pinning classification based on the size of pinning centers is preferred in most cases. The columnar defects are believed to be the most effective pinning centers because they have the largest interaction volume when the vortices are aligned along the defects [15]. Nonsuperconducting second phase additions of nanodimensional size are another way to introduce pinning centers in YBCO. Both multilayers and random nanoparticulate pinning centers of nonsuperconducting second phase materials can be introduced depending upon the technique used [16]. Magnetic doping in YBCO has an important effect on the critical temperature Tc and the critical current density Jc [17–21]. The present work aims to study the effect of nano magnetic and nonmagnetic doping on the critical temperature of YBCO superconductors. Nonmagnetic materials are classified as diamagnetic or paramagnetic, while magnetic materials are classified as ferromagnetic, ferrimagnetic and antiferromagnetic [22].
2. Experimental details
2.1. Preparing nano metal oxides
The co-precipitation method was used for the preparation of nano metal oxides [23–25]. The chemicals used were of analytical grade and used without further purification. Cobalt chloride (CoCl2·6H2O), manganese chloride (MnCl2·4H2O), tin chloride (SnCl2·5H2O), copper chloride (CuCl2·2H2O), cobalt chloride (CoCl2·6H2O), chromium chloride (CrCl3·6H2O) and oxalic acid (C2H2O4·2H2O) with purity 99.5% were used. After which, 5 ml ammonia solution (NH4OH) was added drop by drop in the solution to increase the pH value of the solution prepared with 0.1 M oxalic acid and metal chlorides and then the two solutions interacted and the corresponding metal oxalate preciptated in water. During precipitation the solution was subjected to magnetic stirring at the rate of 550 rpm. The resultant precipitated oxalate solution was kept in an oven for drying over night at 90 °C then the dried product was ground in powder form and put in a furnace at 700 °C for 5 h to obtain nano metal oxide powder.
2.2. Doping YBCO with nano metal oxides
YBCO powder is prepared by the solid state reaction route by mixing a stochiometric amount of Y2O3, BaCO3, CuO followed by grinding, calcination and sintering according to figure 1.
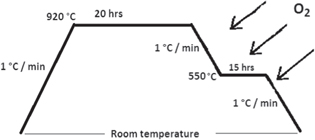
Figure 1. Schematic representation of the heat treatment used in the sample preparation.
Download figure:
Standard image High-resolution imageA series of polycrystalline composite samples of YBCO+x wt% where x = 0.2 of each metal oxides SnO2, Mn3O4, Cr2O3, Co3O4 and CuO were mixed separately and pressed into pellets. The pellets were sintered according to the same curve of heat treatment figure 1. X-ray diffraction (XRD) was done for phase conformation and structural analysis using a Brukur D8 Advance Cu-Kα target with a secondary monochromator (λ = 1.5411 nm) powered at 40 kV and 40 mA. Scanning electron microscopy (SEM) was done for microstructural analysis using Philips XL 30 equipped with an EDX unit, accelerating voltage of 30 KV, magnification up to 400 000×, and resolution of 3.5 nm. Temperature dependent resistivity ρ(T) was measured using the standard four-probe techniques with a Nanovoltmeter (182-KEITHLEY) and constant current source (224-KEITHLEY), with the voltage resolution of 10–8 V of the Nanovoltmeter, and a constant current source of 1 mA flowing through the samples. A closed cycle helium refrigerator consists of a Cryo-compressor, (model: 531-120-IBARA), cooled head, (model: CCS-100EB-JAUS RESEARCH CO.), supplied with a suitable holder, vacuum pump (model: RVB-EDWARDS) and a temperature controller (321-Autotuning Temperature Controller-LAKESKORE); a temperature resolution of ±0.1 K was used for temperature variation.
3. Results and discussion
3.1. XRD analysis of nano oxides
Figure 2 shows the XRD patterns of the obtained nano oxides Co3O4, Cr2O3, CuO, Mn3O4 and SnO2.
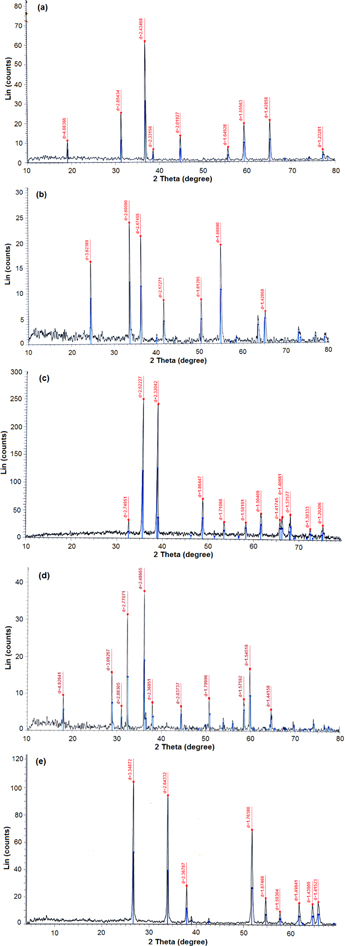
Figure 2. XRD pattern of (a) Co3O4, (b) Cr2O3, (c) CuO, (d) Mn3O4 and (e) SnO2.
Download figure:
Standard image High-resolution imageXRD is a convenient method for determining the mean size of nano crystallites in nano crystalline bulk materials. The first scientist, Paul Scherrer, published his results in a paper that included what became known as the Scherrer equation in 1981 [26]. This can be attributed to the fact that 'crystallite size' is not synonymous with 'particle size', while XRD is sensitive to the crystallite size inside the particles. From the well-known Scherrer formula equation (1) the average crystallite size, L, is:

where λ is the x-ray wavelength in nanometer, β is the peak width of the diffraction peak profile at half maximum height resulting from small crystallite size in radians and K is a constant related to crystallite shape, normally taken as 0.9. The value of β in 2θ axis of diffraction profile must be in radians. The θ is the Bragg angle and can be in degrees or radians, since the cosθ corresponds to the same number. Table 1 shows the average crystal size in a nanometer obtained from the Scherrer equation [27] and the values of the magnetic moment of each metal oxide.
3.2. XRD analysis of YBCO samples
Figure 3 shows the powder XRD patterns of the YBCO samples doped with different metal oxides. The analysis of the data indicates a predominantly single phase perovskite structure YBCO with orthorhombic Pmmm symmetry and small quantities of secondary phases.
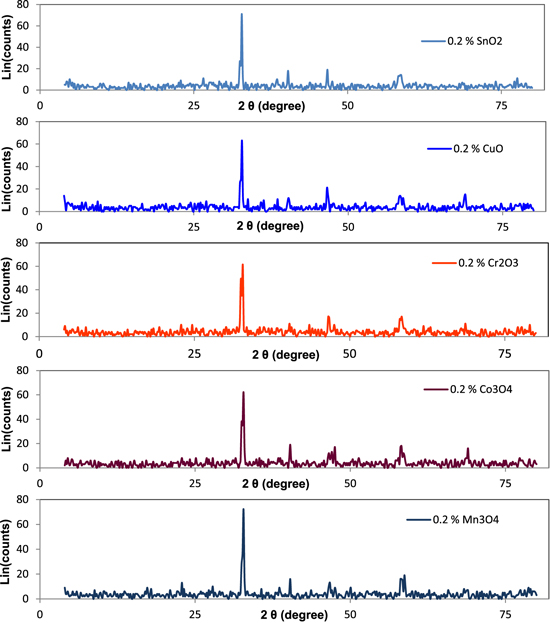
Figure 3. XRD patterns of YBCO doped with different oxides separately.
Download figure:
Standard image High-resolution imageThe lattice parameters of YBCO with orthorhombic structure are a0 = 3.823 Å, b0 = 3.885 Å, c0 = 11.7 Å. It should be mentioned that no peaks corresponding to any other compounds were detected by XRD. The lattice parameters and unit cell volumes of these samples are presented in table 2. It may be noticed that the lattice constants a, b and c change slightly with the different doping of oxides as shown in table 2. For Mn3O4 there is no significant change in a and b parameters while c decreases slightly. The smaller c value could be responsible for a better interlayer exchange and consequently, could give better superconducting properties. For YBCO doped with SnO2 the a parameter increases slightly while b remains constant with a slight decrease in the c parameter. As for doping with Co3O4 and Cr2O3, we find that there is no significant difference in a and b parameters but the c parameter is almost the same. While for SnO2 b and c parameters are only slightly affected but a increased. The difference between a and b parameters reduces the orthorhombicity (δ), and the high value of orthorhombicity of the YBCO samples is the result of high oxygen content and consequently could give better superconducting properties [31].
Table 2. Parameters calculated from XRD graphs.
| Samples of YBCO+x | a(Å) | b(Å) | C(Å) | V(Å3) | δ = (b − a)/(b + a) | O7−δ |
|---|---|---|---|---|---|---|
| x = 0.0 | 3.8230 | 3.885 | 11.7000 | 173.772 554 | 0.008 043 59 | 6.734 800 |
| x = 0.2% SnO2 | 3.8366 | 3.8825 | 11.6894 | 174.120 621 | 0.005 946 29 | 6.796 874 |
| x = 0.2% CuO | 3.8310 | 3.8883 | 11.6712 | 173.855 097 | 0.007 422 95 | 6.903 453 |
| x = 0.2% Cr2O3 | 3.8530 | 3.8693 | 11.7346 | 174.944 262 | 0.002 110 77 | 6.532 182 |
| x = 0.2% Co3O4 | 3.8459 | 3.8796 | 11.6894 | 174.412 320 | 0.004 362 18 | 6.796 874 |
| x = 0.2% Mn3O4 | 3.8277 | 3.8866 | 11.6620 | 173.492 528 | 0.007 635 17 | 6.957 328 |
3.3. Microstructural study
The transmission electron microscopy (TEM) images of YBCO doped concentration of 2% of Co3O4, Mn3O4, CuO, SnO2 and Cr2O3 are shown in figure 4.

Figure 4. TEM images of the nano-metal oxides (a) 0.2% Co3O4, (b) 0.2% Mn3O4, (c) 0, 2% CuO, (d) 0.2% SnO2 and (e) 0.2% Cr2O3.
Download figure:
Standard image High-resolution image
Figure 5. SEM micrographs of YBCO doped (a) 0.2% Co3O4, (b) 0.2% Mn3O4, (c) 0, 2% CuO, (d) 0.2% SnO2 and (e) 0.2% Cr2O3.
Download figure:
Standard image High-resolution imageThe microstructure characterization, i.e. grain size distribution of the composites is shown in figure 5. It shows that the YBCO samples in figure 3 exhibit large grains randomly oriented in all directions with the presence of pores between the grains. From the graphs it is obvious that the grains of all samples are in the same range 1–4 μm. For every doping of nano oxides, it is shown that nano dots are distributed randomly mostly over the YBCO grains. Nano oxide doping of SnO2 tends to gather slightly in some spots between the grains, while Co3O4 and Mn3O4 and CuO show slightly tilted randomization dots on the grains. Cr2O3 tends to form dots in the nanosize range but greater than the other doping oxides and acts as a cover over the grain.
Nanoscale defects shown in the SEM graphs act as pinning centers which determine the current flow and the dissipation of energy through the superconductor. Nanostructures play a dramatic role in optimizing pinning without destroying an unnecessary volume fraction of the superconductor, thereby allowing for a significant increase in Jc [32–35].
3.4. Temperature derivative of resistivity
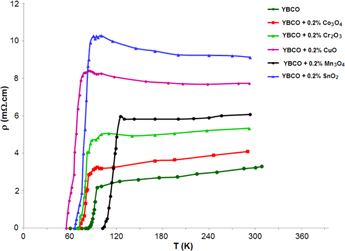
Figure 6 shows the normalized resistance versus temperature plots of YBCO doped with 0.2 wt% of nano metal oxides. Firstly it is characterized by the normal state that shows a metallic behavior (above 2Tc). The normal state resistivity is found to be linear from room temperature to a certain temperature and follows the Anderson and Zou relation ρm(T) = A + BT, where ρm(T) is calculated by using the values of A and B parameters which are obtained from the linear fitting of resistivity in the temperature range 2Tc to 300 K and extrapolated to 0 K gives a resistivity slope (dρ/dT) and residual resistivity ρ0 as seen from figure 6.
Figure 6. Resistivity dependences on the temperature for YBCO+x where x refers to each nano metal oxide doping.
Download figure:
Standard image High-resolution image
The second is the region characterized by the contribution of Cooper pair fluctuations to the conductivity below Tc where ρ(T) deviates from linearity. This is mainly due to the increasing rate of Cooper pair formations on decreasing temperature. Therefore the fluctuation induced conductivity in their region follows all models to yield the dimensional exponent appropriate to fluctuation-induced conductivity. The resistivity decreases with the doping of non magnetic nano metal oxides (Co3O4, Cr2O3, CuO and SnO2) indicating that it adheres to grain boundary forming weak links. The transition temperature from the normal to superconducting state is severely damaged by the addition of non magnetic nano metal oxides (shown in table 2). The depression of Tc with non magnetic nano metal oxide addition may be either due to a decrease in oxygen content in the CuO chains [36] or due to the trapping of mobile holes or some mechanism connected with the oxygen vacancy disorder [37]. Additionally, a close investigation of the resistivity plots shows that there is an increase in Tc for the sample with Mn doping. The increase in the transition temperature for Mn doping (Tc = 112 K) is probably due to the Mn inclusion which reduced the formation of other YBCO phases and enhanced the formation of Y-123. Cu doping shows the highest depression rate followed by Sn, Cr and Co doping because of the fact that Sn and Cu substitute Cu (+2) sites on CuO2 planes in the lattice, whereas Co and Cr occupy Cu (+1) sites along Cu-O chains and they have different magnetic moments.
Table 3 indicates that the values of ρ0 depend on the type of doping and it is obvious that the value of ρ0 increases from the pure YBCO sample. For nano nonmagnetic doping the value of ρ0 increased greater than nano magnetic doping.
Table 3. Variation of normal state and superconducting parameters in different samples.
| Sample | Tc0 (K) | Tc (K) | ΔT (K) | ρ0 (mΩ · cm) |
|---|---|---|---|---|
| YBCO | 87 | 92 | 5 | 2.18 |
| YBCO + 0.2% SnO2 | 67 | 79 | 12 | 10.25 |
| YBCO + 0.2% CuO | 55 | 66 | 11 | 8.3 |
| YBCO + 0.2% Co3O4 | 71 | 81 | 10 | 3.13 |
| YBCO + 0.2% Cr2O3 | 68 | 79 | 11 | 4.7 |
| YBCO + 0.2% Mn3O4 | 106 | 112 | 6 | 5.823 |
4. Conclusion
High Tc YBCO superconductor samples were prepared by traditional solid state reaction and doped with 2 wt% of nano magnetic and nonmagnetic metal oxides namely Mn3O4, Co3O4, Cr2O3, CuO and SnO2. The XRD and SEM analysis showed that there is no other phase in the prepared sample which supports the formation of the nano pinning center at the surface of the grains of Y-123. Tc for different doping was calculated from resistance versus temperature plots. It was found that the doping with non magnetic nano metal oxides (SnO2 and CuO) severely depressed the value of Tc while doping with Cr2O3 (3.8 μB) and Co3O4 (3.02 μB) slightly depressed Tc. Furthermore doping with high magnetic moment Mn3O4 (5.27 μB) increased Tc significantly which is attributed to the inclusion of Mn reducing the formation of other YBCO phases and enhancing the formation of Y-123 with high orthorhombicity and high superconductor properties. Mn3O4 -induced nano-pinning centers may have high pinning efficiency and be one of the main factors for improving the performance of YBCO with improving Tc.