

Abstract
Nanocrystalline NdFeO3 perovskite oxide was prepared by the combustion method using polyvinyl alcohol (PVA) and corresponding metal nitrate precursors under optimum process conditions, using a solution with a pH of 2, a metal/PVA molar ratio of 1:3, and a calcination temperature of 600 °C, and was characterized by x-ray diffraction, scanning electron microscopy, transmission electron microscopy, Brunauer–Emmett–Teller nitrogen adsorption and desorption, energy dispersive x-ray spectroscopy, Fourier transform infrared spectroscopy, laser Raman spectroscopy, and thermogravimetric and differential thermal analysis. The synthesized perovskite NdFeO3, which had an average size of 20 nm and a relatively high surface area of 20 m2 g−1, was investigated for adsorbing hazardous arsenate from aqueous solution. Arsenate adsorption by perovskite NdFeO3 is a pH-dependent process with a high adsorption capacity at pH levels between 4 and 7 and a maximum As(V) adsorption capacity of 126.58 mg g−1, higher than most arsenate adsorbents reported in the literature. Kinetic and equilibrium data of reaction under the experimental conditions are best described by a pseudo-second-order and the Langmuir isotherm equation. The values of enthalpy, Gibbs free energy and entropy changes (ΔH0 = +63.916 kJ mol−1, ΔG0 = −6.551 kJ mol−1 to −14.021 kJ mol−1 at T = 283−313 K, ΔS0 = +0.249 kJ mol−1 K−1) suggested that the reaction was endothermic, spontaneous, and took place with increasing entropy.
Export citation and abstract BibTeX RIS

Original content from this work may be used under the terms of the Creative Commons Attribution 3.0 licence. Any further distribution of this work must maintain attribution to the author(s) and the title of the work, journal citation and DOI.
1. Introduction
The presence of arsenic (As) in water is extremely detrimental to human health [1, 2]. It is of great importance to develop alternative technologies for effectively treating drinking water contaminated by arsenic at a reasonable cost. Various processes, such as coprecipitation, adsorption, and ion exchange [3–5] have been employed for arsenic removal from aqueous solution. Among these, the adsorption process using effective adsorbents appears to be the most promising, as it is one of the most economically favorable methods while being technically easy [6]. Much effort has been devoted to the development of adsorbents for the removal of As from water with both high arsenic adsorption capacity and cost-effectiveness. Numerous sorbent materials have been investigated [7–10] to estimate their arsenic removal efficiency, and the mixed metal oxides showed better efficiency than many of the single metal oxides [11, 12]. In recent years, considerable work has been reported on the preparation of the new bimetal adsorbents containing cerium oxide which have exceptional adsorption performance on arsenic, such as cerium-doped iron oxide (Ce-Fe) [13, 14], cerium-doped manganese oxide (Ce-Mn) [15, 16], and cerium-doped titanium oxide (Ce-Ti) [17, 18]. However, a review of the literature shows that little has been done to use neodymium oxide based adsorbents, and in particular, perovskite-type NdFeO3 nanocrystals for arsenic removal from water have not been evaluated to date. Perovskite-type oxides of general formula ABO3, where B is usually a 3d transition metal surrounded by six oxygen atoms in octahedral coordination and A is normally a rare earth cation, 12-coordinate by oxygen atoms, have been extensively studied for many applications [19]. One of the most common perovskite oxides, NdFeO3 nanocrystal, is very well known due to having a wide variety of applications in, for instance, magnetic materials [20], gas sensors for CO [21], and H2S [22] detection, and has been synthesized by sol-gel [21] and precipitation [23]. Therefore, it is necessary to investigate the arsenate adsorption ability of new NdFeO3 adsorbents.
This work aims to synthesize orthoferrite neodymium NdFeO3 nanocrystals via polymeric precursors prepared by using polyvinyl alcohol (PVA) at a relatively low temperature. The As(V) adsorption process on the new perovskite NdFeO3 adsorbent has been investigated in detail. The adsorbents before and after As(V) adsorption were characterized by Fourier transform infrared spectroscopy (FTIR), laser Raman spectroscopy (LRS), energy dispersive x-ray spectroscopy (EDS), scanning electron microscopy (SEM), and transmission electron microscopy (TEM). The evidence of the participation of M-OH groups in the As(V) adsorption was confirmed by the zeta potential and measurements.
2. Experiment
2.1. Chemicals
All reagents were analytical grade and used as received without further purification. Nd2O3, Fe(NO3)3.9H2O, HNO3, NaOH, and PVA (mol. wt. = 145 000) were purchased from Sigma-Aldrich and Merck.
2.2. Stock As(V) solution
The standard 1000 mg l−1 As(V) stock solutions were prepared by dissolving 4.1653 g Na2HAsO4.7H2O in 1 l of distilled water. Additional As(V) solution was prepared by diluting As(V) stock solution to the given concentration with distilled water.
2.3. Arsenic analysis
The arsenic concentration in solutions was determined by atomic adsorption spectrophotometer with a hydride generator assembly attachment (PerkinElmer) using the methods described in the standard method for the examination of water and waste water [24].
2.4. Synthesis of NdFeO3 adsorbent
The PVA used in gel combustion synthesis of NdFeO3 as a homogenizer is water-soluble and has hydroxyl ligands as side groups which provide complex sites to metal ions [25]. NdFeO3 nanoparticles were prepared by a PVA/nitrate gel combustion synthesis. Nd and Fe nitrates were mixed together in suitable proportions to give a concentrated solution. PVA solution obtained by dissolution in warm water (80 °C) was then proportionally added to the metal solution to ensure suitable amounts. The solution thus obtained was continuously stirred with a magnetic stirrer at ∼80 °C to remove the excess of water and turned into a very viscous transparent brown-colored gel. The clearness of the gel indicated that the composition of the gel was homogeneous. The viscous gel was dried in an air oven at 80 °C for 2 h, and produced a more viscous and bubbly brown mass. No turbidity or precipitation were observed during the process. The obtained mass was calcined at a suitable temperature for 2 h in air to obtain the perovskite-like single-phase NdFeO3.
2.5. Characterization methods
The products obtained during different stages were characterized by x-ray diffraction (XRD) using a Siemens D-5000 diffractometer (Siemens, Germany) with CuKα radiation (λ = 1.5046 Å) in the range of 2θ = 10–60°, and at a scanning rate of 0.02° s−1. FTIR spectra of adsorbent materials were recorded with an Impac-410-Nicolet-FTIR spectrometer, using KBr pellets (KBr in a fixed ratio of 3%), in the region of 400–4000 cm−1, with a resolution of 4 cm−1. The microstructure of the adsorbent was evaluated by SEM and TEM using a Hitachi S4800 microscope. Energy-dispersive x-ray spectra of samples were recorded by a JMS-5410 spectrometer. Thermogravimetric and differential thermal analysis (TGA-DTA) diagrams of the gel precursor were carried out on a Setaram Labsys EVO from room temperature to 900 °C in air at a heating rate of 10 °C min−1. The specific surface area was determined by the Brunauer–Emmett–Teller (BET) method at 77 K using a Quantachrome Autosorb-iQ-MP, and Raman scattering measurements were performed in the backscattering configuration using an XploRa HORIBA Scientific instrument.
In order to determine the point of zero charge (PZC), a 0.05 g l−1 NdFeO3 suspension with 0.5 mM As(V) and without in the desired pH range (2–9) and ion strength (0.01 M NaCl) was shaken at 25 °C and 180 gpm for 12 h. The equilibrium pH was then measured and the suspension was injected into the electrophoretic cell of a Malvern Zetasizer Nano for zeta potential measurement in pentaplicate to obtain the average values. The pH at the point of zero charge was obtained by interpolating the zeta potential data to the zero potential.
2.6. Sorption experiments
A suspension of 50 mg of NdFeO3 and 100 ml of solution containing various amounts of As(V) with ionic strength I = 0.01 M and pH 6.5 ± 0.1 were added separately into a 250 ml glass vessel, and magnetically agitated (speed Sr = 280 gpm) for a duration of 3 h at temperature T = 303 K ± 1 K. After the adsorption, suspensions were centrifuged at the relative centrifugal force of 1200 gpm to collect clear supernatant solution for arsenic concentration analysis.
Some solution pH values (from 2 to 10) were used to examine the solution pH effects on As(V) adsorption by NdFeO3 nanoparticles from aqueous solutions containing 5 mg l−1 and 10 mg l−1.
For the equilibrium isotherm, experiments were carried out with 100 ml As(V) solution of initial concentration in the range 0.5–120 mg l−1 and at a pH of 6.5 ± 0.1.
To investigate the competing effect of coexisting anions on As(V) adsorption, Cl−, 
 and F–1 with a series of concentrations (from 0.1 to 5 mM) were added into the As(V) solutions. All these experiments were carried out with an initial As(V) concentration of 10 mg l−1, an NdFeO3 loading concentration of 0.05 g l−1, a pH 6.5 ± 0.1, and a contact time of 3 h.
3. Results and discussion
3.1. NdFeO3 adsorbent synthesis
In PVA-gel combustion synthesis of NdFeO3 some process conditions, such as solution pH, gel formation temperature, metal/PVA molar ratio, and calcination temperature on the phase of perovskite NdFeO3, were investigated. Figure 1 shows XRD diagrams of the synthesized samples with a metal/PVA molar ratio of 1:3 calcined at 400, 500, 600, 700, and 800 °C. For the cases of the samples calcined at 400 and 500 °C, no crystalline phase was observed which corresponded to the amorphous powder. XRD diagrams of samples calcined at 600, 700, and 800 °C show no peaks attributable to Nd2O3 and Fe2O3 and products are pure perovskite oxide with the orthorhombic single phase of perovskite-type NdFeO3; all diffraction peaks coincided with those of standard pattern (JCPDS file no. 25-1149). Line broadening in the XRD patterns can be quantitatively evaluated and the average particle size of the NdFeO3 nanocrystals is approximately 21, 90, and 110 nm for the samples prepared under the optimum process conditions with a calcination temperature of 600, 700, and 800 °C, respectively, determined from the strongest XRD peak by the Debye–Scherrer equation [26].

Figure 1. X-ray diffraction diagrams of NdFeO3 samples calcined at (a) 400 °C, (b) 500 °C, (c) 600 °C, (d) 700 °C, and (e) 800 °C.
Download figure:
Standard image High-resolution imageMeasuring the effect of the gel formation temperature (figure 2) showed that temperature does not affect the phase perovskite formation of NdFeO3 at 40, 60, 80, or 100 °C. Figure 3 demonstrates the XRD pattern of the perovskite NdFeO3 synthesized at different solution pH levels. It is found that only single-phase NdFeO3 is formed at pH levels of 1 and 2, and that another phase, Nd2O2CO3, is also observed at pH levels of 3 and 4.

Figure 2. X-ray diffraction diagrams of NdFeO3 samples prepared at different solution temperatures: (a) 40 °C, (b) 60 °C, (c) 80 °C, and (d) 100 °C.
Download figure:
Standard image High-resolution image
Figure 3. X-ray diffraction diagrams of NdFeO3 samples prepared at different solution pH levels: (a) pH = 1, (b) pH = 2, (c) pH = 3, and (d) pH = 4.
Download figure:
Standard image High-resolution imageThe other factor that has a strong influence on phase perovskite formation of NdFeO3 is the metal/PVA molar ratio. The XRD patterns of the synthesized powder NdFeO3 with different metal/PVA molar ratios of 6:1, 3:1, 1:1, 1:3, and 6:1 and a calcination temperature of 600 °C are presented in figure 4. When using metal/PVA of 6:1, 3:1, and 1:1 besides the major phase of NdFeO3 we also observed phase Nd2O2CO3 (JCPDS file no. 37-0806), which is similar to the small impurity peak La2O2CO3 observed in reference [27] using PVA for synthesis of LaFeO3, while the only orthorhombic single phase of perovskite-type NdFeO3 was obtained at metal/PVA of 1:3 and 1:6. No peaks attributable to Nd2O3, Fe2O3, or Nd2CO5 were observed.

Figure 4. X-ray diffraction diagrams of NdFeO3 prepared under different metal/PVA molar ratios: (a) 6:1, (b) 3:1, (c) 1:1, (d) 1:3, and (e) 1:6.
Download figure:
Standard image High-resolution image3.2. Characterization of synthesized NdFeO3
According to the representative results for the factors influencing phase perovskite formation of NdFeO3, the optimum process conditions are a solution pH of 2, a gel formation temperature of 80 °C, a metal/PVA molar ratio of 1:3 and a calcination temperature of 600 °C.
3.2.1. TG-DTA analysis, XRD spectra
The TG and DTA diagrams of the gel precursor are presented in figure 5, which shows two discrete weight losses obtained around 185.29, 224.91, and 371.87 °C. The first major weight loss (24.51%) between 120 °C and 300 °C accompanied by exothermic peaks at 185.29 and 224.91 °C in the DTA curve is due to the decomposition of the nitrate and side-chain of PVA. The second weight loss (17.16%), accompanied by exothermic effects between the temperatures ∼300 and ∼600 °C with a maximum at 372 °C, might be associated with the oxidation decomposition of the PVA main chain, further decomposition of nitrate and the direct crystallization of NdFeO3 from the amorphous component. Heating the samples at 600 °C resulted in the formation of the NdFeO3 nanoparticles. It is in good agreement with the XRD results shown in figure 1.
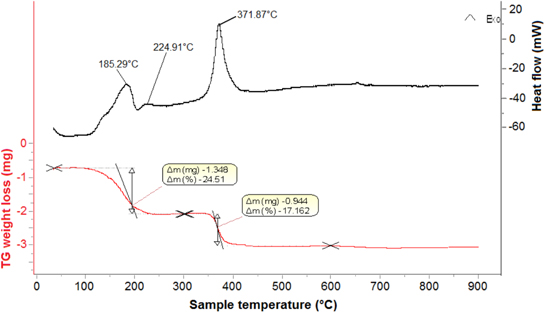
Figure 5. TG and DTA diagrams of the gel Nd-Fe-PVA.
Download figure:
Standard image High-resolution imageThe samples of the synthesized NdFeO3 under the optimum process conditions are the orthorhombic single phase of the perovskite type (from the XRD patterns in figures 1–4), which is identical to that reported in reference [23] using the coprecipitation method for the synthesis of NdFeO3 nanoparticles. Wang et al [28] used the glycine combustion method for the preparation of some perovskites. The crystalline size of the calcined powders was calculated using Scherrer's equation. They lay within a narrow range of 15–20 nm.
3.2.2. BET surface area, SEM, TEM images, and EDS
The BET surface area of calcined powders, prepared by PVA-gel combustion, was found to be 20 m2 g−1 and the BJH (Barret–Joyner–Halenda) average pore diameter and total pore volume were found to be about 21 nm and 11 cm3 g−1, respectively. The data imply that the as-prepared NdFeO3 nanoparticles could be potentially applied in adsorption.
TEM and SEM micrograph images of the NdFeO3 particles provide information on their size and morphology. The morphology of the samples with very homogeneous agglomerates made of nano-sized crystallines has been observed in the SEM images in figure 6 and shows a uniform grain size distribution and a fine powder size in the nanoscale range, between 30 and 50 nm. Figure 7 shows the TEM micrograph image of the NdFeO3 nanoparticles at 100 nm and 20 nm scale. Sphere-like NdFeO3 monodisperse particles with an average size of approximately 20 nm are shown, which agrees well with those calculated (21 nm) by the Scherrer equation using XRD data for the sample NdFeO3. Such consistency implies that the NdFeO3 nanoparticles are single-crystalline.
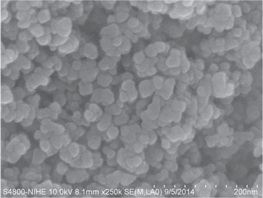
Figure 6. SEM image of the NdFeO3 adsorbent.
Download figure:
Standard image High-resolution image
Figure 7. TEM images of NdFeO3 at (a) 100 nm scale and (b) 20 nm scale.
Download figure:
Standard image High-resolution imageEDS was performed to further confirm the composition of the prepared products. Figure 8 demonstrates the EDS spectra of NdFeO3 nanoparticles before and after arsenic adsorption. The EDS spectra show the presence of neodymium and iron in the adsorbent before As(V) adsorption (figure 8(a)) and the presence of neodymium, iron, and arsenic in the adsorbent after As(V) adsorption (figure 8(b)). It is clear that arsenic presented on the adsorbent after adsorption (about 4.71 mass %). Carbon species presented with a significantly low content of about 2% (the presence of carbon species may also be confirmed by the IR spectra) and the NdFeO3 adsorbent has an Fe/Nd atomic ratio of 0.86 as shown in table 1.

Figure 8. EDS analysis of (a) NdFeO3 adsorbent and (b) loaded NdFeO3.
Download figure:
Standard image High-resolution imageTable 1. The chemical composition of the NdFeO3 adsorbent.
| Before adsorption | After adsorption | |||
|---|---|---|---|---|
| Element | mass % | atom % | mass % | atom % |
| C | 1.86 | 10.07 | 0.84 | 5.02 |
| O | 8.18 | 33.28 | 6.74 | 30.12 |
| Fe | 22.44 | 26.17 | 21.51 | 27.54 |
| Nd | 67.52 | 30.48 | 66.20 | 3282 |
| As | — | — | 4.71 | 4.49 |
3.2.3. The point of zero charge and specific surface area
The surface charge is usually calculated from the balance of protons sorbed and desorbed, with reference to the surface area. The characteristic parameter is the PZC, that is the pH value (pHPZC) for which the surface charge equals zero, i.e. positive and negative sites have equal concentrations. The zeta potential results of the NdFeO3 adsorbent in the absence and presence of As(V) as a function of pH are shown in figure 9. pHPZC occurred at pH 6.1 for NdFeO3 in 0.01 M NaCl. In the presence of 0.5 mM As(V), pHPZC shifted to a lower pH value (approximately 4) and the zeta potential became more negative in the pH range from 4 to 9. The shifts in the pHPZC were used as evidence of inner-sphere surface complex formation [29], because the formation of outer-sphere surface complexes cannot shift the pHPZC (no chemical reaction between the adsorbent and the adsorbent surface). The same trend was observed by Dou et al [14] and Li et al [18].

Figure 9. Zeta potential of the NdFeO3 adsorbent (a) before and (b) after As(V) adsorption.
Download figure:
Standard image High-resolution image3.2.4. FTIR study of NdFeO3 nanoparticles before and after As(V) adsorption
Figure 10 shows FTIR spectra of NdFeO3 adsorbent before (figure 10 curve (a)) and after (figure 10 curve (b)) As(V) binding adsorption at a pH of 6.5 in the frequency range 400–4000 cm−1. The obtained FTIR spectra of perovskite before As(V) adsorption is identical to that reported in [23]. The NdFeO3 adsorbent before and after As(V) adsorption have bands at wave number values around 3200–3500 cm−1, which represent the hydroxyl stretching vibration of O-H bonds, and those around 1622–1630 cm−1, which represent the bending vibration of the physical water molecules [7, 13, 16, 18]. More broad peaks are observed after As(V) adsorption than before As(V) adsorption and the peaks around 1383 cm−1 and 1367 cm−1 can be assigned to the significantly small amount of the carbon species remaining (about 1%) [27, 30], which is reconfirmed by the results of the EDS spectra. A strong band at 1095 cm−1 of NdFeO3 before As(V) adsorption can be assigned to the bending vibration of hydroxyl groups on metal oxides (M-OH; M represents surface metal ions of Nd and Fe) [13, 16]. This observation demonstrates that the NdFeO3 nanoparticles have high adsorption capacity to hydroxyl groups existing on their surfaces. After As(V) adsorption (curve (b) in figure 10) the FTIR spectra of NdFeO3 clearly indicated that the M-OH bending band decreased. Some researchers have reported that the peak of the hydroxyl groups decreased or disappeared after the As(V) adsorption on the Fe-Mn [12], Fe-Ce [13], and Ce-Ti [18] adsorbents. These observations indicate that the hydroxyl groups on the adsorbent surface were involved in the arsenic adsorption [13, 18]. On the other hand, a new band appeared at 852 cm−1 which corresponds to the stretching vibration of an uncompleted As-O bond (figure 10 curve (b)) [13, 14, 31, 32]. The formation of an As-OM bond indicates that the As(V) adsorption onto NdFeO3 nanoparticles also follows the inner-sphere complex mechanism (see [8]). The FTIR study results indicate that the substitution of M-OH groups by arsenic species plays a key role in their adsorption. The peaks at 501 cm−1 and 559 cm−1 attributed to the M-O stretching vibration decreased to 455 cm−1 and 546 cm−1 after As(V) adsorption, suggesting a change of M-O groups after the adsorption.

Figure 10. FTIR spectra of the NdFeO3 adsorbents (a) before and (b) after As(V) adsorption.
Download figure:
Standard image High-resolution image3.2.5. Raman spectra changes before and after As(V) adsorption
Raman spectroscopy is very useful to obtain further information on the As(V) adsorption on the NdFeO3 adsorbent. Raman spectra of the NdFeO3 adsorbent at pH = 6.0 ± 0.1 in the frequency range from 100 cm−1 to 1500 cm−1 are shown in figure 11. Curve (a) of figure 11 shows the Raman spectrum of the NdFeO3 nanocrystals before As(V) adsorption. The bands at 141, 214, 286, 341, 439, 631, 857, and 1299 cm−1, and the rather weak bands between 700 and 1000 cm−1, are more similar to those reported in reference [33].

Figure 11. Raman spectra of NdFeO3 before As(V) adsorption (a) and As(V) loaded (b).
Download figure:
Standard image High-resolution imageThe intensity of some peaks at 631 and 1299 cm−1 in the Raman spectrum of NdFeO3 before As(V) adsorption (curve (a) in figure 11) were decreased after As(V) binding adsorption (curve (b) in figure 11). This is due to the substitution of the M-O bond by an M-OAs bond. When oxygen is protonated, the M-O bond is strong, but the substitution of the –H atom by the arsenic species has weakened the M-O bond since the arsenic species attached to the M-O group is much more electronegative than the –H atom. This fact implies that an inner-sphere surface complex has been formed on the adsorbent surface [34]. Moreover, a new mode at around 857 cm−1 (curve (b) in figure 11) may be attributed to the vibration of the As-O bond, indicating the presence of arsenic species in the NdFeO3 sample.
According to the above presented results of EDS, pHPZC, FTIR, and Raman spectra measurement, evidence of the presence of As(V) on NdFeO3 nanoparticles can be confirmed.
3.3. As(V) adsorption onto the NdFeO3 adsorbent
3.3.1. Effect of initial pH on the adsorption process
Figure 12 shows the effects of solution pH on the As(V) removal on the NdFeO3 adsorbent. As can be seen, the As(V) removal was evidently dependent on pH, with the greatest adsorption occurring under acidic conditions and decreased with increasing solution pH. It was found that the As(V) sorption capacities were nearly constant, 20 mg g−1 and 5 mg g−1 for the initial As(V) concentration of 10 mg l−1 and 5 mg l−1, respectively, up to pH 6.5, and decreased from pH 6.5 to pH 10, which can be explained by the pHPZC value (pHPZC = 6.1) of NdFeO3. According to the As(V) speciation at pH 7.0, all arsenate complexes are dissociated as  and
and  species [35]. Those species will undergo an attraction/repulsion on the adsorbent surface, depending on the nature of its charge. The positive surface of NdFeO3 binds the
  and
and  Coulombic forces strongly up to the pH < pHPZC. As solution pH was increased from pH 6.1, the negative charge on the adsorbent increased and the positive charge decreased. The surface of NdFeO3 should transform to negative, and repel the
  or
or  species for likeness of charges, resulting in the observed decrease in As(V) adsorption. The same trend in the effect of pH on arsenic removal was observed by other researchers [16, 18, 32, 36]. The As(V) removal by NdFeO3 adsorbent was maintained at the high adsorption capacity at pH levels up to 7.0. It is reasonable to assume that, in addition to electrostatic interaction, chemical interaction exists, which will be discussed below.

Figure 12. Effect of pH on adsorption capacity of As(V) by the NdFeO3 adsorbent at different concentrations of As(V) of 5 mg l−1 and 10 mg l−1.
Download figure:
Standard image High-resolution imageThe above results of the zeta potential and FTIR analysis suggested that possible adsorption reaction of As(V) onto NdFeO3 nanoparticles could be realized through the replacement of the OH group of M-OH with arsenate for the formation of surface complexes.
3.3.2. Adsorption isotherms
Adsorption isotherms provide some of the most useful data for understanding the mechanism of adsorption, and the characteristics of isotherms are needed before the interpretation of the kinetics of the adsorption process. Many modes have been proposed to explain adsorption equilibrium, however, no general model has been found to fit the experimental data accurately under any given condition. Among various methods employed for analyzing the nature of adsorbate–adsorbent interaction, adsorption isotherms are the most significant. The present study used Langmuir and Freundlich isotherms, which are most often used to describe the equilibrium adsorption of metal ions and are usually used to describe the equilibrium adsorption data [32, 37].
The Langmuir equation is

For linearization of the data, it can be written in the form

The Freundlich equation is

The above presented equation was linearized to determine the process parameters as given below

where qe is the amount of arsenic adsorbed (mg g−1) at equilibrium, qm and KL are Langmuir constants related to monolayer adsorption capacity (mg g–1) and adsorption equilibrium constant (l mg−1), respectively, Ce is the equilibrium arsenic concentration (mg l−1), and KF and n are the Freundlich constants related to the adsorption capacity (mg g−1) and adsorption intensity, respectively. The plots of Ce/qe versus Ce, and logqe versus logCe, yielded straight lines. The values of qm and KL, KF can be calculated from the slopes and intercepts, respectively. The results of As(V) adsorption studies relating to the Langmuir and Freundlich equations at different concentrations of As(V) for pH 6.5 on a fixed amount of adsorbent are presented in figure 13 and summarized in table 2.

Figure 13. Adsorption isotherms of As(V) on the NdFeO3 adsorbent at pH 6.5 concerning different adsorption models.
Download figure:
Standard image High-resolution imageTable 2. Equilibrium adsorption isotherm fitting parameters for As(V) adsorption onto the NdFeO3 nanoparticles at pH 6.5, ionic strength I = 0.01 M NaCl and T = 303 K.
| Parameter | Langmuir model | Freundlich model |
|---|---|---|
| KL (l mg−1) | 0.271 | |
| KF (mg g−1) | 26.773 | |
| qmax (mg g−1) | 126.58 | |
| R2 | 0.999 | 0.932 |
| χ2 | 0.145 | 3.203 |
| n | 2.245 |
Based on either the statistical error (χ2) or the correlation coefficient (R2) values, it could be suggested that adsorption of As(V) by NdFeO3 nanoparticles was best modeled with the Langmuir equation (1) (χ2 = 0.145, R2 = 0.999), and better than the Freundlich equation (2) (χ2 = 3.203, R2 = 0.932). The maximum adsorption capacity of As(V) (qm = 126.58 mg g−1) for NdFeO3 was given in table 3 for comparison with other adsorbents. It shows that NdFeO3 has a higher maximum As(V) adsorption capacity than that of the different adsorbents reported earlier, except [13].
Table 3. Comparison of Langmuir adsorption capacities of different adsorbent materials.
| Adsorbent | Maximum adsorption capacity of As(V) qmax (mg g−1) | Reference |
|---|---|---|
| Fe-Mn composite | 69.75 (pH 5.0) | [36] |
| Ce-Mn | 18.65 (pH 7.0) | [31] |
| Ce-Ti (0.075-0.160 mm) | 43.86 (pH 6.5) | [30] |
| CeO2 | 107.1 (pH 7.0) | [32] |
| CuO | 22.6 (pH 8.0) | [38] |
| Fe-Ce | 150 | [13] |
| NdFeO3 | 126.58 (pH 6.5 ± 0.1) | present study |
3.3.3. Thermodynamic and kinetic studies
In this section the thermodynamic and kinetic aspect of the As(V) adsorption process will be considered. The experimental data obtained at different temperatures were used in calculating thermodynamic parameters such as Gibbs free energy (ΔG0), enthalpy (ΔH0), and entropy (ΔS0) using the standard relations available in literature [39]:


where K is the equilibrium constant obtained from Langmuir isotherms at different temperatures and R is the universal gas constant, ΔH0 and ΔS0 were obtained from the slope and intercept of the plot of ln(qe/Ce) versus 1/T (figure 14), namely: ΔHo = +63.916 kJ mol−1 and ΔSo = +0.249 kJ mol−1 K-1, ΔGo = −6.551 kJ mol−1, −9.041 kJ mol−1, −11.531 kJ mol−1, and −14.021 kJ mol−1 at 283 K, 293 K, 303 K, and 313 K, respectively. The negative values of ΔGo obtained from equation (5) reflect a spontaneous adsorption process of As(V), while the positive value of ΔH indicates that the adsorption reaction is endothermic and the As(V) adsorption is more effective at higher temperatures.

Figure 14. The plot of lnK versus 1/T.
Download figure:
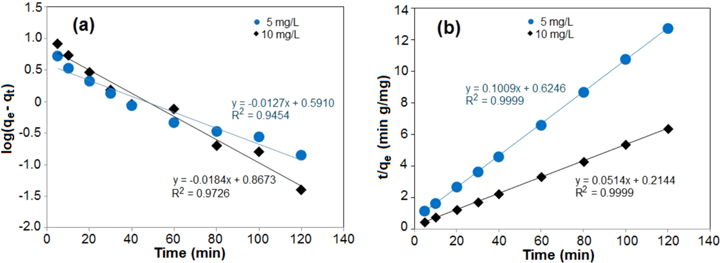
Standard image High-resolution imageKinetic studies determined the contact time of the adsorbent with adsorbate and evaluate reaction coefficients. Figure 15 shows the As(V) removal by NdFeO3 adsorbent as a function of contact time with different initial As(V) concentration of 5 mg l−1 and 10 mg l−1, and the maximum uptake was observed within 100 min. Kinetic models have been used to test experimental data to investigate the kinetic adsorption mechanism. The kinetic models commonly used include the first-order rate equation and pseudo-second-order equation.

Figure 15. Plots of time-dependent adsorption capacity of As(V) by the NdFeO3 adsorbent.
Download figure:
Standard image High-resolution imageThe pseudo-first-order model for the sorption of a liquid/solid system based on solid capacity is usually written as follows [40, 41]:

where qe and qt are the amounts of As(V) adsorbed (mg g−1) at the equilibrium time and time t (min), respectively, and k1 is the rate constant of adsorption (l min−1). The slope and intercept of log(qe-qt) versus time t were used to determine the first-order-rate constant as shown in figure 16(a). The linear fit gives the correlation coefficient R2 values of 0.945 and 0.972 for initial As(V) concentration of 5 mg l−1 and 10 mg l−1, respectively.
Figure 16. Adsorption kinetics of As(V) by NdFeO3 for (a) the pseudo-first-order and (b) the pseudo-second-order model.
Download figure:
Standard image High-resolution image
The pseudo-second-order equation based on adsorption capacity depends on time and is usually expressed as follows [42]:


where h (mg g−1 min−1) denotes the initial sorption rate, and k2 (g mg−1 min−1) is the rate constant of adsorption.
The linear plot of t/qe versus time t confirms that the sorption rate followed pseudo-second-order kinetics (figure 16(b)). The linear fit gives correlation coefficient values for R2 of 0.999 for initial As(V) concentration of 5 mg l−1 and 10 mg l−1. Based on the square of the correlation coefficient R2, the adsorption processes followed the pseudo-second-order kinetic model better (the R2 is closest to 1) than the pseudo-first-order kinetic model. Table 4 presents the rate constants.
Table 4. Estimated values of pseudo-first-order and pseudo-second-order kinetic model parameters for As(V) adsorption on NdFeO3 adsorbent.
| Pseudo-first-order parameters | Pseudo-second-order parameters | |||||||
|---|---|---|---|---|---|---|---|---|
| As(V) concentration (mg l−1) | k1 (l min−1) | qe (mg g−1) | R2 | χ2 | k2 (g mg−1 min−1) | qe (mg g−1) | R2 | χ2 |
| 5 | 2.76 × 10⁻² | 3.90 | 0.945 | 0.100 | 4.67 × 10⁻² | 10.00 | 0.999 | 0.014 |
| 10 | 4.15 × 10⁻² | 7.36 | 0.972 | 0.087 | 1.21 × 10⁻² | 19.61 | 0.999 | 0.032 |
3.3.4. Effect of competing anions
Due to the complexity of substances in natural water, there might be competition from other species which may largely deteriorate the arsenate removal performance by adsorption. The effect of coexisting anions on arsenate adsorption on the NdFeO3 nanoparticles was examined. Here, the effect of coexisting anions on arsenate removal was assessed by investigating the influence of several ubiquitous anions, such as chloride, sulfate, phosphate, and fluoride ions on the arsenate adsorption at three levels (0.1, 1.0, and 5.0 mM), the pH of 6.5 ± 0.1, and the initial arsenate concentration of 10 mg l−1. As shown in table 5, the removal of arsenate was obviously hindered by phosphate as compared to chloride, sulfate, and floride. This adverse effect may be attributed to preferential adsorption of phosphate ions by the NdFeO3 surface competing with arsenate in solution because of the similar chemistry of phosphate and arsenate. Table 5 shows that chloride did not inhibit the arsenate adsorption process even though they coexisted at high concentration, suggesting that they had low affinity toward the adsorbent, and while a slight decrease of arsenate removal was observed when the floride and sulfate concentrations were as high as 5 mM, the total removal of As(V) was still over 92 and 98%, respectively. Similar adverse effects of these anions on metal oxide adsorbents were reported elsewhere [32].
Table 5. Effect of competing anions for arsenate adsorption on the NdFeO3 nanoparticles (initial As(V) concentration of 10 mg l−1, loading NdFeO3 of 0.05 g l−1).
| % As(V) removal in the presence of | ||||
|---|---|---|---|---|
| Competing anion concentration (mM) | Cl− |

|
F− |

|
| 0 | 99.1 | 99.1 | 99.1 | 99.1 |
| 0.10 | 99.1 | 99.1 | 99.1 | 75.4 |
| 1.00 | 99.1 | 99.1 | 99.0 | 35.2 |
| 5.00 | 99.0 | 98.5 | 92.5 | 15.8 |
3.3.5. Regeneration and reuse
The regeneration and reuse of the spent NdFeO3 adsorbent for As(V) removal in the successive sorption–desorption cycles were investigated by HCl, HNO3, NaOH, NaCl, and Na2CO3 solutions. The 0.5 M NaOH solution was the best eluent solution for arsenic desorption from the preliminary experimental results (98.59, 97.38, 86.28, 55.90, and 24.52% for NaOH, HNO3, HCl, NaCl, and Na2CO3 solutions, respectively). The desorption of arsenate from the spent adsorbent may be due to the electrostatic repulsion between the negative sites on the adsorbent surface and anionic arsenate in NaOH solution. After the regeneration in 0.5 M NaOH solution, the regenerated NdFeO3 adsorbent was used in the next cycle, and the adsorption capacities of the adsorbent for As(V) in the successive five cycles decreased (the percentage of As(V) adsorption of 95.20, 90.60, 87.20, 85.10, and 82.50% for the first, second, third, fourth, and fifth cycles, respectively). Li et al [18] observed the same result when investigating arsenic removal from water by a Ce-Ti oxide adsorbent.
4. Conclusion
Single-phase nanocrystalline powder of NdFeO3, with an average particle size of 20 nm and BET surface area of 20 cm2 g−1, was synthesized from polymeric gel precursors made by using PVA as homogenizer at the optimum conditions (pH 2, gel formation temperature of 80 °C, metal/PVA molar ratio of 1:3). Upon heating the gel, crystallization occurred at a relatively low temperature of 600 °C. pHPZC of the NdFeO3 adsorbent occurred at pH 6.5 in 0.01 M NaCl and the presence of As(V) of 10 mg l−1 shifted to low pH values (about 4), while the zeta potential became more negative in the pH range of 5–9, which confirmed the evidence of inner-sphere surface complex formation. The adsorption isotherms indicated that the NdFeO3 adsorbent had high As(V) adsorption capacity at pH values ranging from 2 to 7 and decreased rapidly when the solution pH was increased from 7 to 10. The As(V) adsorption onto the NdFeO3 nanoparticles was better fit by the Langmuir isotherm model than the Freundlich model. The maximum As(V) adsorption capacity of the NdFeO3 adsorbent reached the value of 126.58 mg g−1, much higher than most arsenate adsorbents. The FTIR analysis indicated that the hydroxyl groups on the adsorbent surface were involved in the As(V) adsorption. The As(V) adsorption onto the NdFeO3 nanoparticles at pH 6.5 ± 0.1, I = 0.01 M NaCl and T = 303 K obeys the pseudo-second-order kinetics. The equilibrium data of the As(V) adsorption with NdFeO3 was endothermic (ΔHo = +63.916 kJ mol−1) and spontaneous (ΔGo = −6.551 kJ mol−1 to −14.021 kJ mol−1 at T = 283–313 K) and took place with increasing entropy (ΔSo = +0,249 kJ mol−1 K−1). Electrostatic interaction occurred in the As(V) adsorption, and the hydroxyl groups bonded to the NdFeO3; nanoparticles played an important role in adsorption via the formation of the complexes on the adsorbent's surface. The presence of competing anions such Cl−, 
 , and F− did not greatly interfere with the As(V) adsorption, while the presence of
  significantly decreased the As(V) adsorption. The spent adsorbent could be effectively regenerated by 0.5 M NaOH solution for repeated use without any significant capacity loss.
Acknowledgments
This work was financially supported by Vietnam's National Foundation for Science and Technology Development (NAFOSTED) with Project code 104.03-2013.10.