

Abstract
A novel N-pyridin-2-ylmethylsuccinamic acid-functionalized smectite nanomaterial was synthesized by immobilizing of N-pyridin-2-ylmethylsuccinamic acid through chemical bonding onto (3-aminopropyl)triethoxysilane modified smectite. The structural, thermal, morphological and surface properties of raw, silane-grafted and the N-pyridin-2-ylmethylsuccinamic acid-functionalized smectites were investigated by various characterization techniques. The thermal analysis data showed the presence of peaks in the temperature range from 200 °C to 600 °C due to the presence of physically adsorbed silanes, intercalated silanes, surface grafted silanes and chemically grafted silane molecules between the smectite layers. The powder x-ray diffraction patterns clearly indicated that the aminopropyl molecules also intercalated into the smectite interlayers as bilayer arrangement whereas N-pyridin-2-ylmethylsuccinamic acid molecules were only attached to 3-aminopropyltriethoxysilane molecules on the external surface and edges of clay and they did not intercalate. Fourier transform infrared spectroscopy confirms N-pyridin-2-ylmethylsuccinamic acid molecules bonding through the amide bond between the amine group of aminopropyltriethoxysilane molecules and a carboxylic acid functional group of N-pyridin-2-ylmethylsuccinamic acid molecules. The guest molecules functionalized onto the smectite caused significant alterations in the textural and morphological parameters of the raw smectite. The anchoring of N-pyridin-2-ylmethylsuccinamic acid molecules led to positive electrophoretic mobility values when compared to starting materials. N-pyridin-2-ylmethylsuccinamic acid-functionalized smectite was employed as an electroactive ingredient in the structure of potentiometric PVC-membrane sensor. The sensor exhibited more selective potentiometric response towards chlorate ions compared to the other common anionic species.
Export citation and abstract BibTeX RIS

Original content from this work may be used under the terms of the Creative Commons Attribution 3.0 licence. Any further distribution of this work must maintain attribution to the author(s) and the title of the work, journal citation and DOI.
1. Introduction
Smectite clays are a group of 2:1 type layered clay mineral species, the most important of which are montmorillonite, saponite, nontronite, beidellite and hectorite [1–3]. Smectites, especially montmorillonite clay minerals, play a major role in preparation of organoclays as a host material because of their layered silicate structures, high cation exchange capacities, great adsorption abilities, nontoxic properties, high surface areas, dispersions in water, porosities, hydration and perfect swelling properties [4–12]. The preparation of organoclays is an important process to improve the physical–chemical properties of clays. Generally, organoclays are prepared by intercalation of organic reagents such as cationic, anionic, non-ionic and amphoteric surfactants into interlayer space of clay minerals [13–15]. The intercalation of cationic surfactants may both change the charge of the raw smectite (RS) layer from negative to positive if the excess of organic cations is available and increase the basal spacing of RS [13, 16–18]. However, after the surface modification with cationic surfactants, no effective interaction between clay mineral and other reactive species such as polymer matrix, photoactive species, metallic cations, some metal complexes, drug molecules, organic molecules and proteins occurs. Therefore, covalent grafting of silane species on clay minerals have attracted a great deal of attention because of their satisfied performance characteristics in attachment of other reactive species [19–32]. In this processes, silane species are easily intercalated into the interlayer space of smectite and all internal surfaces, external surfaces and broken edges are also easily grafted with silane under moderate conditions [19–32]. The grafted silane molecules mainly take place on internal surfaces, external surfaces and 'broken' edges by forming covalent bonds between silane molecules and clay surface hydroxyls which allows us to obtain special functional NH2 groups for immobilization of desired secondary reactive species [19, 20, 33]. Due to the improved structural and surface characteristics of clays, silane grafting and organosilane materials have been widespreadly used in environmental applications, preparation of novel materials, electrolyte polymer membrane developments, clay ceramics, improvement of paints, polymer nanocomposite, immobilization of metal complexes, heterogeneous catalysis, electrochemistry, biosensors, adsorption of heavy metal ions (metal affinity), drug delivery systems and enzyme immobilization [34–46]. There are progressively increasing studies in the field of silane grafted materials due to improvement of clay features. The synthesis of this kind of novel materials means the existence of new application areas, and there have been still considerable needs to prepare hybrid organic-clay materials. Although there are studies related to 3-aminopropyltriethoxysilane (APTES) grafted-clay composites, there is no report on N-pyridin-2-ylmethylsuccinamic acid (PMSA) functionalized APTES-smectite composites and their physicochemical properties.
Potentiometric ion-selective electrodes are most widely used analytical tools among the other analytical techniques because of their superior properties such as high selectivity, wide working range, lower detection limit, fast response, simple measurement process, low price, no pre-treatment, and compact implementation. In recent years, clay modified electrodes have been attracting interests in electrochemical sensors applications. Some studies related to voltammetric and potentiometric sensor applications of clays and surfactant-modified clays have been carried out [47–51]. However, there is no report on potentiometric electrode study based on N-pyridin-2-ylmethylsuccinamic acid (PMSA) functionalized to silane-grafted clays.
In the current study, initially, we have synthesized a silane-grafted smectite by reacting APTES with smectite (APTES-S). Afterwards, synthesized PMSA was attached to APTES molecules with amide bond formed by interaction between the amine groups of APTES-S and the carboxyl group of the PMSA molecule. The structural, thermal and morphological properties of RS, APTES-S and PMSA functionalized-smectite (PMSA-S) samples were characterized by utilizing powder x-ray diffraction (PXRD), Fourier transform infrared spectroscopy (FTIR), thermogravimetry-derivative thermogravimetry and differential thermal (DTA) analyzes, scanning electron microscopy (SEM), electrophoretic mobility measurement and surface area measurement techniques. Finally, these characterized surface modified smectites were implemented as electroactive materials in the constructions of novel PVC membrane chlorate-selective electrodes.
2. Experimental
2.1. Preparation of APTES-smectite
6 ml of APTES were dissolved in 60 ml of toluene, and 5 g of smectite were added to this mixture. The final mixture was refluxed for 30 h under nitrogen atmosphere. Then, it was filtrated, washed with toluene and dried for 2 d at 60 °C.
2.2. Preparation of N-pyridin-2-ylmethylsuccinamic acid (PMSA)
20 mmol of succinic anhydride was dissolved in 20 ml ethyl acetate in a flask, and 20 mmol of 2-pyridinemethylamine was dissolved in 20 ml ethyl acetate in another flask. Succinic anhydride solution was added dropwise to 2-pyridinemethylamine solution [52, 53]. The final mixture was stirred for 6 h. The formed crystals were filtered, washed with ethyl acetate and dried for 2 d at 60 °C.
2.3. Preparation of PMSA-S
1.0 g of APTES-S and 0.4 g of PMSA were added into 20 ml of dimethylformamide (DMF) and stirred half an hour. Then, 0.6 ml of trimethylamine and 0.4 ml of ethyl chloroformate were added to this mixture. The obtained mixture was stirred for 32 h at 0 °C in an ice-bath. The mixture was filtrated, washed with DMF and dried for 2 d at 50 °C (figure 1).
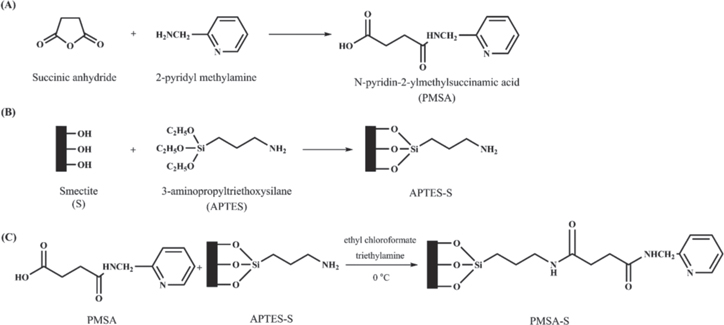
Figure 1. Synthesis stages of PMSA-S material.
Download figure:
Standard image High-resolution image2.4. Preparation of electrodes
The preparation of the electrodes was carried out in three stages. In the first stage, 300 mg of the conductive solid contact mixture (consisting of 50.0% (w/w) graphite, 35.0% (w/w) epoxy and 15.0% (w/w) hardener) was thoroughly dissolved in 3.0 ml of tetrahydrofuran (THF). After the conductive solid contact mixture reached to appropriate viscosity, a shielded copper wire with 15.0 cm length and 0.5 mm radius was dipped into this mixture a few times to obtain a solid-state contact with a coating thickness of about 0.2 mm. The coated copper wire was kept at room temperature for about 1 d. In the second stage, 100 mg membrane cocktail consisting of 10.0% (w/w) ionophore, 28.0% (w/w) PVC, 62.0% (w/w) o-nitrophenyloctyl ether (NPOE) was prepared by dissolving in 1.0 ml of freshly distilled and dried THF. In the final stage, the surface of the conductive solid contact was coated with the membrane cocktail by dipping the solid contact coated copper wire into the cocktail 4–5 times until about 0.2 mm membrane thickness was obtained. The membrane coated electrode surface was left to be dried in laboratory conditions overnight. Subsequently, the prepared chlorate selective electrode was conditioned for at least 4 h by soaking into 0.1 M sodium chlorate (NaClO3) solution [51].
The PXRD profiles were recorded at ambient temperatures on a PANalytical Empyrean diffractometer using Ni filtered CuKα radition (λ = 1.540 50 Å; 45 kV and 40 mA). The attenuated total reflection Fourier transform infrared (ATR-FTIR) spectra of the samples were taken on Thermo Nicolet 6700 spectrophotometer in the region 4000–400 cm−1 at a resolution of 4 cm−1. Thermal analysis runs were performed simultaneously on a EXSTAR TG/DTA apparatus in a dynamic air atmosphere from room temperature 1000 °C at a heating rate of 10 °C min−1 (calcinated α-alumina was taken as the reference). The percentage of the loaded silane (LS%) is calculated from thermal analysis data using equation (1), which gives the percentage of organic silane species with respect to the total inorganic mass [29]

In this equation, W150–720 corresponds to the mass loss between 150 °C and 720 °C of the loaded silane molecules. SEM observations were made with the Quanta FEG 450-FEI instrument. Nano-ZSP (Malvern, UK) zeta potential analyzer was used to measure the electrophoretic mobility values in region of pH 2–12. Nitrogen adsorption/desorption isotherms were obtained in the relative pressure range from 10−5 < P/Po < 1.00 using 0.15–0.40 g of samples at 77 K with a Quantachrome Autosorb-İQ-2 analyzer (Florida, USA). The samples were degassed in vacuum at 120 °C for 6 h prior to the textural measurements at 77 K. Specific surface areas (SBET) were determined by using the Brunauer–Emmett–Teller (BET) method adsorption data in the relative pressure (P/Po) range 0.05–0.35. Langmuir specific surface areas (SL) were calculated automatically by the equipment using Langmuir equation with the use of adsorption isotherms. The micropore surface area (tSμp) and micropore volume (tVμp) were determined by t-plot analysis in the relative pressure (P/Po) range 0.2–0.5. Mesopore surface areas (BJHSmp) and volumes (BJHVmp) were determined using the Barrett–Joyner–Halenda (BJH) method. In addition, the average pore widths (APWBET) were also determined.
3. Results and discussion
3.1. PXRD data of samples
Figure 2 shows the PXRD patterns of the RS, APTES-S and PMSA-S samples. The d001, d020-100, d130-200 and d060 reflections of the main montmorillonite component of RS are seen at 7.27°, 19.92°, 35.13° and 61.84° (2θ) with the corresponding distance of 12.16, 4.45, 2.55 and 1.50 Å, respectively (curve (a) in figure 2). The peak at 22.05° (2θ) with the distance of 4.04 Å attributed to the opal-cristobalite/tridymite (opal-CT) and the peaks at 26.71° and 50.18° (2θ) with the values of 3.34 Å and 1.82 Å, respectively, assigned to quartz (Q). The d001 and the d060 peaks are located at 12.16 and 1.50 Å which indicate that the smectite mainly contains a sodium-montmorillonite and a dioctahedral montmorillonite, respectively [54, 55]. On grafting/intercalation of APTES into the layers of smectite, a very strong peak with the distance of 20.96 Å corresponding to the newly formed diffraction plane at 4.21° (2θ) which can be attributed to the smectite swelling due to the grafting/intercalation of APTES into the interlayer space of the clay [19, 21, 26, 28]. Furthermore, the diffraction peak belonging to the d002 plane of APTES-S is observed at 8.08° (2θ) with the distances of 10.93 Å. Typically, grafting/intercalation process between the layers of clay results in a significant change in interlayer distance because gallery height are mainly related to the molecular dimension and arrangements of grafted/intercalated species [51]. The arrangements of the APTES species within the gallery space of smectite can be estimated by comparing the interlayer expansions and molecular size of the APTES molecule. According to literature data, the sheet thickness of the smectite tetrahedral-octahedral-tetrahedral (TOT) unit is 9.70 Å and the height of aminopyropyl group of the APTES molecule is approximately 6.0 Å [21, 23, 51]. The interlayer expansion calculated subtracting the thickness of the smectite TOT unit (9.70 Å) from basal spacing of APTES-S is 11.26 Å which is assigned to presence of a bilayer arrangement models of the aminopropyl molecules in the interlayer space of the smectite. Similar findings are reported in the literature [21, 23, 31]. The d001 and d002 peaks of PMSA-S samples are observed at 4.25° and 8.12° (2θ) with the distance of 20.79 Å and 10.88 Å, respectively, and a new peaks of nearly the equivalent intensity with the d002 peak also arise at 12.32° and 19.99°(2θ) with the values of 7.18 and 4.44 Å belonging to PMSA molecules. However, the treatment of the APTES-S composite with PMSA did not significantly affect on location of the PXRD patterns and the d001 peak remains nearly unchanged. This situation indicates that the PMSA has not been attached to amine groups of intercalated/grafted APTES molecules in the interlayer space. However, PMSA was attached to APTES molecules on the external surface and edges with amide bond formation by reaction between the amine groups of APTES-S and the carboxyl group of the PMSA molecule [53]. In addition, this situation confirms that APTES has also grafted on the external surface and the broken edge of the smectite platelets and thus the structure of the APTES-S prevented the intercalation of PMSA species as a locking effect [27]. Thus, both intercalated/grafted APTES species between the smectite platelets and grafting of APTES on the external surface was confirmed by XRD data, which is in good agreement with the thermal analysis and FTIR spectra.
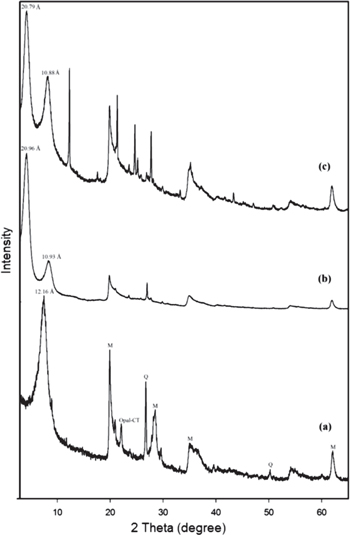
Figure 2. PXRD patterns of the smectite samples (a) RS, (b) APTES-S, (c) PMSA-S.
Download figure:
Standard image High-resolution image3.2. ATR-FTIR data of samples
FTIR spectroscopy is usefull technique to confirm the presence of adsorbed, intercalated and grafted species on the surface and in the interlayer space of clay [19, 22, 23, 28]. The comparative FTIR spectra of RS, APTES-S and PMSA-S samples are presented in figure 3. The bands at 3628 and 916 cm−1 corresponds to the OH stretching of structural hydroxyls and deformation bands of AlAlOH, respectively, whereas the broad band at 3424 cm−1 and the band at 1636 cm−1 belong to the OH stretching and bending vibration of sorbed water molecules in RS, respectively. Furthermore, the strong absorption band at 1035 cm−1 is a result of Si–O–Si stretching and the bands at 620, 521 and 467 cm−1 are assigned to coupled Al–O and Si–O, Al–O–Si deformation and Si–O–Si deformation of RS, respectively. In addition, a peak at 792 cm−1 is observed, which is attributed to the presence of opal-CT and quartz as nonclay components. The adsorption/grafting/intercalation of APTES into/on the smectite resulted in a decrease of the intensity of OH stretching and bending vibration of sorbed water molecules at 3402 and 1635 cm−1 significantly, due to a decrease in the adsorbed and interlayer water content and new characteristic vibrational bands also emerge at 3380, 3313, 2935, 2875, 1610, 1558, 1542, 1524, 1508, 1475, 1457, 1400 and 697 cm−1 originating from APTES molecules which confirmed a successful reaction between APTES and clay [22, 23, 28]. The IR bands at 2935 and 2875 cm−1 correspond to the asymmetric and symmetric stretching vibrations of methylene groups (CH2) of APTES, respectively, whereas the bands at 3380 and 3313 cm−1 may be assigned to the asymmetric and symmetric stretching of the NH2 group of APTES [19, 22, 23, 28]. The broad band at 1610 cm−1 belong to the bending mode of free amine groups which are characteristic of APTES [22, 24, 26, 29, 32]. Furthermore, peaks at 1558, 1457 and 1400 cm−1 correspond to N–H deformation, Si–C stretching and C–N stretching, respectively and the C–H deformation peaks are located at 1508, 1475 and 697 cm−1 following the adsorption/intercalation/grafting of the APTES species onto clay, which was also detected in infrared spectrum of pure APTES [22, 24, 26, 29, 32]. In addition, the intensity losses in stretching and deformation bands of structural hydroxyls at 3624 and 918 cm−1, respectively, prove the grafting of APTES molecules onto M–OH clay groups (also confirmed by thermal analysis techniques) [22, 24, 26, 29, 32].

Figure 3. FTIR spectra of the smectite samples (a) RS, (b) APTES-S, and (c) PMSA-S.
Download figure:
Standard image High-resolution imageThe successful amide bond formation between the amine groups of APTES molecules and carboxylic acid groups of PMSA molecules was confirmed by FTIR spectroscopy. Amide I bands arise to the C=O stretching vibrational modes which are situated around 1700–1630 cm−1 whereas the amide II bands are assigned to N–H bending and C–N bending vibrations which are located around 1630–1460 cm−1. Furthermore, the peaks in 1280–1190 cm−1 region are ascribed to amide III band due to vibration involving N–H bending and O–C–N stretching [56, 57]. The interaction of PMSA molecules with the APTES-S resulted in a significant decrease in the intensity of the NH2 (primary amine) stretching and deformation modes at 3380 and 1610 cm−1 and new bands emerge at 1660, 1619 and 1235 cm−1 originating from amide functional groups [56–58]. Thus, the peaks at 1660, 1520 and 1235 cm−1 in PMSA-S attributed to amide I, II and III bands, respectively, denoting the occurrence of amide bonds between the NH2 groups of APTES molecules and carboxylic acid functional groups of PMSA molecules [53, 56–58]. Furthermore, such bonding would create a secondary amine, the presence of new bands at 3294 and 760 cm−1 correspond to N–H stretching (amid A) of secondary amine and the composed of C=O bending (in-plane) and C–C stretching (amide IV), respectively, signify the amidation reaction between APTES and PMSA [58]. Additionally, the features at 3030, 2983, 2938, 2496, 1445 1385 and 1362 cm−1 correspond to aromatic C–H stretching, asymmetric C–H stretching, symmetric C–H stretching, aromatic ring, Si–C stretching, asymmetric C–H bending and symmetric C–H bending, respectively, further supports the covalent bonding of PMSA onto APTES-clay, which were also observed in FTIR spectrum of pure PMSA. In addition, the Si–O stretching (longitudinal mode), Si–O–Si stretching, coupled Al–O/Si–O, and Al–O–Si deformations of all samples were observed almost at the same wavenumbers. This result shows that the interaction of APTES and PMSA molecules did not a prominent effect on the linkage of Si–O and Al–O bonds in tetrahedral sheet.
3.3. Thermal analysis of samples
The thermal analysis (TG/DTG and DTA) profiles of the RS, APTES-S and PMSA-S are illustrated in figure 4. The elimination of adsorbed water (moisture) with a mass loss of 10.10% in the first stage 30 °C–130 °C on the TG curve of RS gives rise to DTG peak centered at 81 °C and the DTG peak at 149 °C in the range of 130 °C–204 °C which is accompanied by a mass loss of 2.0% corresponds to the removal of the water species coordinated to the interlayer cations. The small mass loss (∼1.0%) screened between 204 °C and 500 °C on the TG curve of RS was attributed to structural OH groups dehydroxylate releasing water [51, 55]. In addition, the dehydroxilation (DHx) of smectite occurs with a mass loss of 3.3% in the temperature range of 500 °C–750 °C as a single-step process which gives rise to a maximum DTG peak at 636 °C. For RS, the total mass losses in the temperature range of 30 °C–750 °C and the solid residue (RE) were calculated from the present thermal analysis data as 16.4% and 83.6%, respectively. The total mass losses are changeable for raw and modified smectites whereas the mass ratio of DHx and the solid RE should be constant for raw and all the modified smectites [59]. This ratio (DHx/RE) for RS was calculated as 0.0395 from the thermal analysis data (table 1).
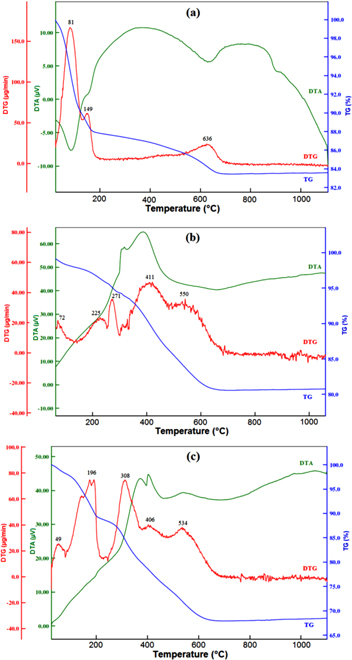
Figure 4. Thermal analysis curves (TG, DTG and DTA) of smectite samples (a) RS, (b) APTES-S, and (c) PMSA-S.
Download figure:
Standard image High-resolution imageTable 1. Some thermal analysis data of RS, APTES-S and PMSA-S obtained from the TG curves.
| Sample | Total water (%) | DHx(%) | APTES(%) | PMSA(%) | RE(%) |
|---|---|---|---|---|---|
| RS | 12.10a | 3.3 | — | — | 83.60 |
| APTES-S | 1.9b | 3.19 | 14.21 | — | 80.70 |
| PMSA-S | 1.70c | 2.68 | 14.21 | 13.41 | 68.00 |
aAdsorbed and interlayer water, bAdsorbed water and APTES, cAdsorbed water and APTES+PMSA DHx: dehydroxylation; RE: residue at 780 °C.
There were obvious differences in the TG/DTG/DTA curves of APTES-S compared to that of the RS. The thermal analysis data were used to determine the amount of silanes as a simple method. The APTES-S represents a DTG peak at 72 °C in the temperature range of 30 °C–132 °C; with a mass loss of 1.9% which can be attributed to the desorption of physically adsorbed water/physically adsorbed silane [22]. Furthermore, APTES-S have three characteristic DTG peaks in the temperature interval of 130 °C–490 °C resulted from the gradual elimination of the silane molecules that are adsorbed to the surface by adsorbed, intercalated and/or grafted, whereas the RS did not show significant mass losses in this temperature region [22]. The first mass loss by 2.3% between the 130 °C and 254 °C (DTGmax = 225 °C) is corresponded to the adsorbed silane species hydrogen bonded to the surface hydroxyl groups present in the broken edges of the clay platelets [22]. A well-developed DTG peak at 271 °C in the region 254 °C–316 °C which is accompanied by a mass loss of 1.8% on the TG curve is associated with intercalated silane species between the smectite layers, and then a mass loss of 8.0% in the range of 316 °C–489 °C (DTGmax = 411 °C) is attributed to the chemically grafted silane species with broken-edge platelets and chemically grafted silane species into smectite interlayer [22]. After that, a wide range of overlapped dehydroxylation of smectite hydroxyls together with the decomposition of grafted silane species processes occurred in the temperature ranges 500 °C–720 °C. The differentiation of the mass losses originating from the decomposition of the grafted silane species and dehydroxylation of smectite by using the TG curve is highly arduous [51, 59]. Therefore, the percent mass losses of silane species were calculated by using the DHx/RE ratio, it is 3.19% interval of 500 °C–720 °C. The total removal amounts of silane species in the temperature ranges 150 °C–720 °C is 14.21% whereas the percentage of the loaded silane on/into smectite calculated from equation (1) is 18.18%, and some thermal analysis data were summarized in table 1.
The thermal curves of PMSA-S indicated that PMSA bonded to APTES and APTES decompose together from the PMSA-S sample. The loaded species mainly presents three DTG peaks at 196 °C, 308 °C and 406 °C in the range of 100 °C–478 °C on the TG curve of PMSA-S composite which are related to the gradual elimination of the APTES together with PMSA, while the DTG peak centered at 534 °C in the temperature range of 478 °C–720 °C with a total mass loss of 6.8% corresponds to the dehydroxylation process of smectite together with decomposition of grafted PMSA/APTES species. The mass losses of dehyroxylation and decomposition of grafted PMSA/APTES species were calculated (from DHx/RE as explained above) as 2.68% and 4.12%, respectively. The higher mass losses (27.62%) of the PMSA-S composite (figure 4(c)) than that of the APTES-S (14.21%) in the temperature range 100 °C–720 °C implicate the fact that the PMSA molecules are immobilized through the formation of an amide bond between carboxylic acid group on PMSA and the primary amine group of APTES on the APTES-S. However, PMSA molecules mainly was interacted with APTES molecules (grafted and hydrogen bonded the surface hydroxyl groups present in the broken edges of the clay platelets) on the external surface of the smectite, providing a locking effect which prevents the intercalation of the PMSA molecules in the interlayer space of the APTES-S [22]. This situation was confirmed by the basal spacing value of PMSA-S, determined by powder XRD data, which showed no increase in the interlayer space. Besides (furthermore finally), both dehydration and dehydroxylation temperatures of modified clays (APTES-S and PMSA-S) shift the lower values compared to RS.
3.4. Surface area measurements of samples
The textural parameters of the RS, APTES-S and PMSA-S are shown in table 2. The specific BET surface area of RS, of which the mesoporous surface area (34.75 m2 g−1) is higher than microporous surface area (13.13 m2 g−1), was determined as 46.37 m2 g−1. The textural parameters show that both surface area (111.24 m2 g−1) and mesopore volume (0.21 cm3 g−1) highly increase after grafting of APTES in/on smectite, whereas the average pore width of RS (10.17 nm) decreases to 8.15 nm. The increase in surface areas of APTES-S material may be ascribed to the increase of mesopores. Although, the grafting process produced a remarkable increase in the mesoporous surface area from 13.13 to 94.86 m2 g−1 for APTES-S, the microporous surface area and micropore volume disappeared. This situation shows that the APTES-S composite has almost mesoporous structure. On anchoring of PMSA molecule in the samples with APTES, the specific surface area of APTES-S (111.24 m2 g−1) decreased by ca. 10-fold for PMSA-S (11.64 m2 g−1). The sharp decrease in surface area of PMSA-S may be attributed to blocking of the pore openings of clay accessible for nitrogen adsorption and also a consequence of an increase in aggregation. In addition, no microporosity was observed in this sample. Therefore, the surface area and mesoporous volume of this material result mainly from the outer surface of the crystallites and their aggregation [60].
Table 2. Textural parameters of RS, APTES-S and PMSA-S samples.
| Sample | SBET (m2 g-1) | SL (m2 g−1) | tSμp (m2 g−1) | BJHSmp (m2 g−1) | tVμp (cm3 g−1) | BJHVmp (cm3 g−1) | APWBET (nm) |
|---|---|---|---|---|---|---|---|
| RS | 49.37 | 58.36 | 12.13 | 31.75 | 0.006 | 0.11 | 10.17 |
| APTES-S | 11.64 | 13.31 | — | 12.54 | — | 0.07 | 24.07 |
| PMSA-S | 111.24 | 127.12 | — | 94.86 | — | 0.21 | 8.15 |
3.5. SEM measurements
SEM images of RS, APTES-S and PMSA-S are presented in figure 5. There are some differences in the morphology of the modified samples compared to that of the pure smectite. The SEM image of RS shows aggregated, curved plates and crenulated edges while the surfaces of modified smectites (APTES-S and PMSA-S) have less foliated and more uniform. In modified smectites, the structures are looser and the distinctive crenulated edges disappear. This appearance of modified smectites may be attributed to the attachments of APTES and PMSA molecules on the clay layers.
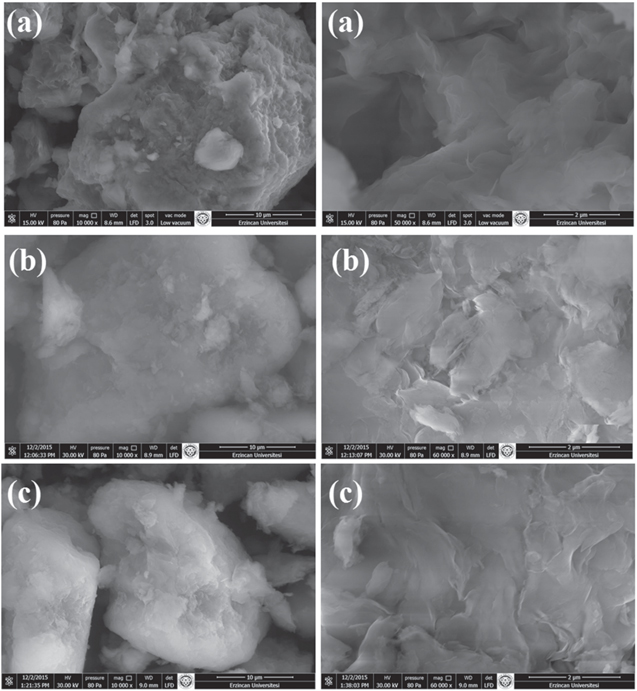
Figure 5. The SEM images of smectite samples at different magnifications (a) RS, (b) APTES-S and (c) PMSA-S.
Download figure:
Standard image High-resolution image3.6. Electrophoretic mobility measurements
The electrophoretic mobility-pH curves of the RS, APTES-S and PMSA-S and the related electrophoretic mobility values are given respectively in table 3. The electrophoretic mobility values of clays are especially important in order to define its surface charge properties. The electrophoretic mobility of smectite particles are related to two different types of charges on smectite surface, both permanent negative charge on the plate face and the pH-dependent charges at the edges [16, 17]. Clay plate face have permanent negative charge sites on the basal planes owning to the isomorphous substitution of the central Si- and Al-ions in tetrahedral and/or octahedral sheets by the cations with lower positive charge whereas octahedral Al–OH and tetrahedral Si–OH groups situated at the broken edges are positively or negatively charged depending on the pH [61]. As shown in table 3, the electrophoretic mobility values of RS decreases as a result of the protonation of the smectite surface at lower pH values. Obviously, the RS showed negative electrophoretic mobilities even at pH = 2 which indicates the dominance of the permanently negative charged siloxane basal face [62]. The electrophoretic mobility values of both APTES-S and PMSA-S shifted to positive values and decreased with the increasing pH, even above pH = 10. For APTES-S, the reason of the gradual increase in positive electrophoretic mobility values at lower pHs can be explained with the protonation of the amine groups on the surface of the modified clay. However, the electrophoretic mobility values of PMSA-S are higher than those of APTES-S which may be attributed to the presence of the more protonable functional groups such as N–Hs of amides, oxygens of carbonyls and nitrogen of pyridine.
Table 3. Electrophoretic mobility values of samples at different pH values.
| Electrophoretic mobility (μm cm V−1 s−1) | ||||||
|---|---|---|---|---|---|---|
| Sample | pH = 2 | pH = 4 | pH = 6 | pH = 8 | pH = 10 | pH = 12 |
| RS | −1.35 | −1.71 | −1.68 | −1.89 | −2.03 | −2.36 |
| APTES−S | 1.49 | 1.53 | 1.29 | 0.15 | −0.93 | −1.01 |
| PMSA-S | 2.89 | 2.57 | 2.11 | 1.02 | −0.76 | −1.84 |
3.7. Potentiometric electrode applications
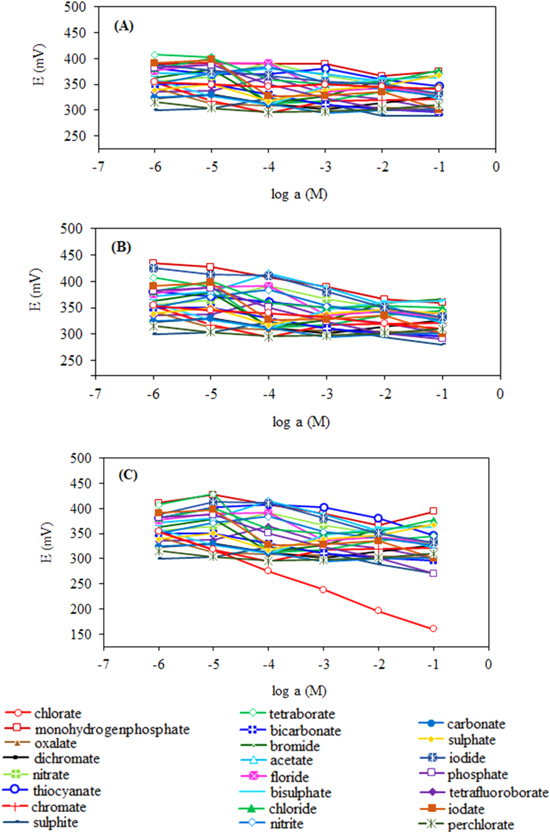
To investigate the potential use of modified clay as ionophore in the structure of potentiometric PVC-membrane electrodes, various membrane compositions were prepared by using raw clay, APTES-clay and modified clay. Potentiometric measurements were performed in various commonly encountered anion solutions (prepared from sodium salts) in the concentration range of 1.0 × 10⁻⁶–1.0 × 10⁻¹ M by using the prepared PVC-membrane electrodes and the potential-activity plots were created with the obtained measurements (figure 6). As can be seen in figure 6, the prepared electrode exhibited more selective potentiometric response towards chlorate ions compared to the other common anionic species. Further studies on potentiometric performance tests of the proposed electrode (such as optimum membrane composition, selectivity coefficients, linear working range, detection limit, pH working range, response time, life time and reproducibility) are going to be carried out in our subsequent study.
Figure 6. Potentiometric sensor behavior of smectite samples: (A) RS, (B) APTES-S and (C) PMSA-S.
Download figure:
Standard image High-resolution image
4. Conclusions
Functionalization of PMSA molecules onto smectite surface was achieved by modification with APTES-S. The structural, thermal, textural and morphological properties of this hybrid material and starting materials were investigated by various characterization techniques. This modification process induced a significant improvement of the selective potentiometric electrode response to chlorate anion as compared to the starting and APTES-S samples. The appearance of new amide bands and the emergence of new characteristic vibrational bands originating from the PMSA molecules on the IR spectrum of hybrid material proved that the successful anchoring of guest molecules onto clay surface through covalent bonding with APTES molecules. Combinatorial interpretation of XRPD and thermal analysis data showed that anchoring of PMSA molecules occurred on the external surface and edges of clay, no proof was found for the presence of functionalization in the interlayer space. However, the existence of physically adsorbed silanes, intercalated silanes, surface grafted silanes and chemically grafted silane molecules between the smectite layers were detected for APTES-S material. The intercalation of APTES into the smectite layers caused an expansion of basal spacing from 12.16 to 20.96 Å and it may be proposed based on this expansion that APTES molecules might be located as a bilayer arrangement. The considerable decreased in the surface area of PMSA-S compared to RS was explained by the blockage of the pore openings with the PMSA species which prevents nitrogen adsorption. The morphology of pure smectite was affected by the modification process and the modified composites had less foliated and more uniform surface appearance. The RS has negative electrophoretic mobility values originating from the dominance of the permanently negative charged siloxane basal face whereas the electrophoretic mobility values of both APTES-S and PMSA-S shifted to positive values which may be attributed to the presence of more protonable functional groups. The obtained findings in the current study indicate that, as selective electroactive materials, functionalized clays have great potentials in the field of potentiometric sensor technology.