

Abstract
The inhibition effect of magnetic nanofluid on carbon steel in acid solutions was investigated using gravimetric, potentiodynamic and SEM measurement. The inhibition efficiency increases up to 95% and 75% for 51.7 mM concentration, respectively, in 1 M HCl and 1 M H2SO4 medium. The adsorption of nanoparticles to the steel surface forms a barrier between the metal and the aggressive environment, which is responsible for observed inhibition action. The adsorption of nanoparticles on steel surface is supported by the Langmuir and Freundlich adsorption isotherm and surface morphology scanned through SEM.
Export citation and abstract BibTeX RIS

Original content from this work may be used under the terms of the Creative Commons Attribution 3.0 licence. Any further distribution of this work must maintain attribution to the author(s) and the title of the work, journal citation and DOI.
1. Introduction
Carbon steel finds wide application as a construction material for heat transport system in nuclear, petrochemical, and chemical process industries. However, this material is highly prone to corrosion in an acidic environment. In order to prevent corrosion, different techniques are used like: treatment of metal surface coating [1, 2], treating the environment in which metal is exposed by removal of oxygen, controlling pH or using inhibitors [3–5] and changing the potential by cathodic or anodic protection.
With the advancement in high-performance nanostructured materials development, effectiveness of corrosion-resistant under a wider range of hostile environments is also established. Due to the regulated restriction of using chromate because of its high toxicity and carcinogenic characteristic, there arose the interest to research of chromium free alternative with equivalent or superior corrosion inhibition performance. A magnetic nanofluid (MNF) comprising myriad tiny ferromagnetic nanoparticles in aqueous media has a wide range of applications in engineering (like seals, dampers, loudspeakers, vibration and shock absorbers) to biomedical fields [6–8]. These nanoparticles are in the size range from 3 to 15 nm, which forms a stable suspension after coating with a stabilizer.
In our earlier approach we have shown the use of properly designed MNF as a promising corrosion preventive material [9, 10]. Our experiments of corrosion resistance of carbon steel with 1.0 M HCl and 1.0 M H2SO4 medium show almost 95% and 75% inhibition efficiency, respectively.
This work describes the mechanism responsible for the inhibiting action of MNF in the strong acidic media. The performance of MNF inhibitor is evaluated using gravimetric, polarization measurement technique and the surface morphology study through SEM. The inhibitive action is explained based on the empirical relations of Langmuir and Fraundlich adsorption isotherms.
2. Experimental
The procedure of preparing magnetic fluid inhibitor comprises of three parts: (i) magnetite nanoparticles were synthesized by chemical co-precipitation technique, (ii) these particles were then coated with citric acid and (iii) dispersion of coated particles in distilled water. The detail procedure of synthesis is described in our earlier study [9–11]. The resulting colloidal suspension is magnetized only in the presence of gradient magnetic field, therefore was tested for stability under 0.5 T gradient magnetic field. No sediments were observed at the bottom of the vial. This serves as an indicator of colloidal stability. The crystallite size of particles was obtained from powder x-ray diffractometer (pattern not shown here) and transmission electron microscope (figure 1(a)). The typical size obtained from both the techniques is 9.9 nm ± 1 nm. The histogram of the particles fits well with log-normal diameter distribution function, P(D)dD, given by
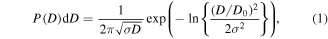
where P(D)dD is log-normal diameter distribution function, ln(D0) is a mean value of ln(D) and σ is the size distribution in ln(D). The best fit values obtained from the fitting are D0 = 9.9 nm and σ = 0.176.
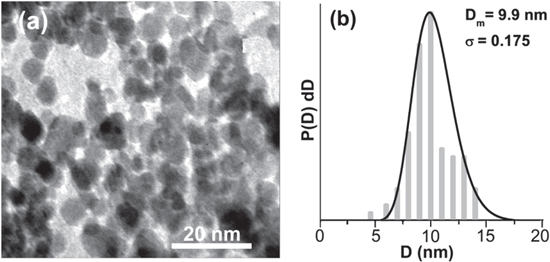
Figure 1. (a) TEM image of nanoparticles ans (b) the particle size histogram obtained from TEM image which is fitted with log-normal diameter distribution function.
Download figure:
Standard image High-resolution imageIn the present study carbon steel specimen of chemical composition C = 0.16%, Mn = 0.2%, S = 0.05%, P = 0.07%, Si = 0.2% and remaining iron were used. The samples were abraded with different emery paper up to 4/0 grades, washed with doubly distilled water, cleaned with acetone and finally dried in a furnace at 60 °C.
The polished and pre-weighed specimens of carbon steel of 5 × 2 × 0.06 cm3 were suspended in 200 ml of the test solution without and with the MNF inhibitor at different concentrations for a period of 4 h at 30 °C. Figure 2 shows the photograph of gravimetric experiment made on a carbon steel sample in 1 M HCl solution. The yellow color of the solution indicates the presence of MNF inhibitor. Blank is without the inhibitor, i.e., only 1 M HCl solution. The inhibitor concentration varied from 6.9 to 64.6 mM. The color of the solution slowly disappears as time progresses. The specimens after a period of 4 h were removed from the solution, washed, dried and weighed. The weight of the specimens was measured using high precision balance before and after the experiment. The weight loss thus obtained was used to calculate the corrosion rate in mg cm−2 h−1. The similar experiment was performed for 1 M H2SO4 medium.
Figure 2. Photograph of blank, 6.9, 30.1, 51.7 and 64.6 mM concentrations of MNF inhibitor in 1.0 M HCl, respectively, from left to right at time t = 0 h and after 4 h.
Download figure:
Standard image High-resolution imageFor electrochemical measurement, Gamry instrument reference 600 potentiostat/galvanostat/ZRD model was used for the experiment. The saturated calomel electrode (SCE) and a platinum counter electrode were used as reference and auxiliary electrodes, respectively The working electrode of steel specimen was covered with epoxy adhesive, araldite, so that its cross sectional area (1 cm2) was in contact with the acidic solution. Analytical grade hydrochloric acid, sulfuric acid (Merck) and doubly distilled water was used to prepare acid solution for all experiments. In any case, the experiment was carried out in static conditions. All potential values in this paper were referred to the SCE.
3. Results
3.1. Gravimetric measurement
Figure 3(a) shows the influence of MNF inhibitor concentration on the weight loss of the carbon steel substrate in 1.0 M HCl and 1.0 M H2SO4 medium. As the concentration of inhibitor increases the weight loss decreases, irrespective of the medium of acid. In the case of HCl medium, 51.7 mM inhibitor concentration shows the minimum weight loss, while the same is not true for H2SO4 medium. This is possible due to the strong acidic strength of H2SO4 compared to HCl. The percentage inhibition efficiency, η (%), was determined by considering the corrosion rates of carbon steel, WWL and WWL (inh), respectively in the absence and the presence of the inhibitor. The value of the same is reported in table 1. Figure 3(b) shows the inhibition efficiency as a function of inhibitor concentration obtained from the gravimetric measurement. In the case of HCl medium, almost 95% inhibition reached at inhibitor concentration of 51.7 mM, whereas H2SO4 medium shows 65% inhibition at the same concentration. In the latter case, the value does not show the saturation behavior for the concentration studied.

Figure 3. (a) Weight loss measurement and (b) percentage inhibition efficiency η (%) as a function of MNF inhibitor concentrations C in 1.0 M HCl and 1.0 M H2SO4. Line is guide to eye for both the figures.
Download figure:
Standard image High-resolution imageTable 1. Parameters derived from weight loss measurement for carbon steel in 1.0 M HCl with and without different concentrations of inhibitors at 30 °C.
| 1 M HCl | 1 M H2SO4 | |||
|---|---|---|---|---|
| Inhibitor concentration (ppm) | WWL (mg cm−2 h–1) | η (%) | WWL (mg cm−2 h–1) | η (%) |
| 0 | 2.6812 | — | 3.52 | — |
| 160 | 2.1133 | 21 | — | — |
| 300 | 1.6229 | 39 | — | — |
| 700 | — | — | 1.93 | 45.2 |
| 1000 | 0.5129 | 81 | 1.59 | 54.8 |
| 1200 | 0.2560 | 90 | 1.25 | 64.5 |
| 1500 | 0.2664 | 90 | 1.10 | 74.4 |
3.2. Polarization measurement
Figure 4 shows the polarization measurement carried out at 303 K respectively for MNF inhibitor concentrations in 1.0 M HCl and 1.0 M H2SO4 solution. Corrosion potential (Ecorr) and corrosion current density (Icorr) were deduced from the plot and is mentioned in table 2. The parameters derived from Tafel plot shows that Icorr of steel is lower when MNF inhibitor is used. The result also shows that the corrosion rate obtained from polarization measurement Wpol in blank sample, i.e., 1.0 M HCl/H2SO4 is highest which decreases upon increasing MNF inhibitor concentration and reaches to lowest at 51.7 mM concentration. The percentage inhibition efficiency η (%) of the inhibitor for the corrosion of steel was calculated using the corrosion current density Icorr with and without an inhibitor. From the figure 4, it is observed that MNF inhibitor slightly affects both the cathodic and anodic Tafel constants, βC and βA, respectively. The optimum inhibitor concentration in this measurement for HCl medium is also found as 51.7 mM indicating that nanoparticles layer has reached the maximum protection at this concentration.
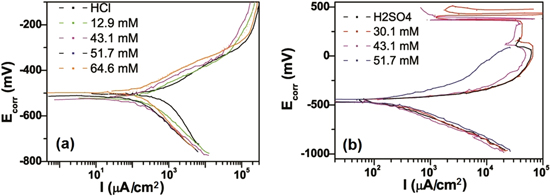
Figure 4. Polarization measurement with different concentrations of MNF inhibitor in (a) 1.0 M HCl and (b) 1.0 M H2SO4.
Download figure:
Standard image High-resolution imageTable 2. Potentiodynamic polarization parameters for carbon steel in 1.0 M HCl with and without different concentrations of inhibitors at 30 °C.
| Inhibitor concentration (ppm) | βA (mV decade−1) | βC (mV decade−1) | Icorr (μA cm−2) | Ecorr (V) | Wpol(mpy) | η (%) | |
|---|---|---|---|---|---|---|---|
| 1.0 M HCl | 0 | 113.5 | 244.3 | 785.0 | −503 | 355.2 | — |
| 300 | 86.2 | 142.7 | 232.0 | −518 | 105.1 | 70.4 | |
| 1000 | 107.3 | 143.7 | 171.0 | −522 | 77.2 | 78.3 | |
| 1200 | 89.3 | 139.4 | 113.0 | −514 | 51.2 | 85.6 | |
| 1500 | 80.6 | 158.6 | 142.0 | −498 | 64.4 | 82.9 | |
| 1.0 M H2SO4 | 0 | 57.2 | 191.0 | 133.0 | −459 | 60.7 | — |
| 700 | 49.4 | 135.8 | 75.9 | −458 | 34.7 | 45.2 | |
| 1000 | 53.5 | 139.0 | 67.5 | −461 | 30.8 | 54.2 | |
| 1200 | 36.7 | 96.8 | 63.1 | −458 | 28.8 | 70.3 | |
4. Discussion
The plausible mechanism for increased inhibition efficiency with increasing MNF concentration can be explained as follows. The nanoparticles are constantly moving in the solution because of the Brownian motion and hence particles near to the carbon steel substrate get trapped inside the voids present on its surface. These particles slowly form a layer on the surface of the steel and protect the surface from the harsh acidic environment. With increasing concentration (C) from 30.1 to 51.7 mM the surface coverage (θ) increases, which shows an increase in the inhibition efficiency. At an optimum concentration the surface is fully covered by the nanoparticles, making a complete monolayer on steel surface resulted in optimum inhibition efficiency in HCl medium. On further increasing the concentration of particles there are two possibilities (i) formation of a monolayer of the film remain intake, additional particles will just replace the other particles in a film, i.e., making and breaking of the film by physical motion of the particles resulted in the saturated value of corrosion or (ii) multilayer formation of particles on the surface of the substrate. In order to understand the concept of monolayer formation, the data on inhibition efficiency are fitted with the empirical adsorption isotherm. The basic assumptions in Langmuir isotherm are: (i) the surface of the adsorbent is uniform, that is, all the adsorption sites are equal, (ii) adsorbed molecules do not interact, (iii) all adsorption occurs through the same mechanism and (iv) at the maximum adsorption, only a monolayer is formed: i.e., molecules of adsorbate do not deposit on other already adsorbed molecules of the adsorbate, they deposit only on the free surface of the adsorbent.
Figure 5(a) shows graphical relation between C/θ versus C for the experimental data taken in the HCl as well as H2SO4 medium. The data fit well with the Langmuir adsorption isotherm in HCl medium with a slope of 0.66 and best fit value R2 of 0.97. In the case of H2SO4 medium, the slope and R2 values are 0.54 and 0.85, respectively. As the R2 value for H2SO4 medium is away from unity, the Freundlich adsorption isotherm is used to fit the result. The Freundlich adsorption isotherm assumes heterogeneous adsorption surface, which does not have an adsorption maximum. Figure 5(b) shows the plot of θ versus logC. In both the plots, the line is a fit to the respective curve. The value of 1/n, obtained from the slope of the curve is 5.05 and R2 value is 0.97. This expression reduces to a linear adsorption isotherm when the heterogeneity parameter 1/n is equal to 1. If 1/n lies between one and ten, this indicates a favorable sorption process [12]. In the present case 1/n = 5 indicates that cooperative adsorption of nanoparticles is taking place on steel surface [13]. The lower value of inhibition efficiency in case of H2SO4 probably indicates interference of sulfate ions which leads to lower adsorption and lower inhibition [14, 15].

Figure 5. (a) Langmuir adsorption isotherm retrieved by gravimetric measurement (plot of C/θ versus C) of carbon steel in 1.0 M HCl and 1.0 M H2SO4 solution containing different concentration of MNF inhibitor. (b) Freundlich adsorption isotherm retrieved by gravimetric measurement (plot of θ versus logC) of carbon steel in 1.0 M H2SO4 solution containing different concentrations of MNF inhibitor.
Download figure:
Standard image High-resolution imageAfter a critical concentration, the movement of nanoparticles disrupts the layer covered on the surface of carbon steel. Since the film is just physically adsorbed, as it can be seen from fitting the data with Langmuir and Freundlich adsorption isotherm, the formation and the breakage of the film will be enhanced above a critical concentration. This results in a slight decrease or saturating behavior in inhibition efficiency. It is also observed that the inhibition in H2SO4 is lower because there is not much synergism between the sulfate ions and the non-magnetic particles. This observation of getting the lower value of inhibition in case of H2SO4 compared to HCl medium matches with the result reported in [16].
Our logic of adsorption of nanoparticles on steel surface can be supported by the careful observation of figure 2, which shows photographs of the gravimetric experiment. The acid medium is transparent, which after the addition of MNF inhibitor shows brownish yellow color. The color of the solution indicates the presence of nanoparticles. With increasing MNF inhibitor concentration the color becomes intense. This color disappears upon 4 h of exposure time. As time progresses, the particles start attracting towards the substrate and fills the void on the surface. This leads to decrease in the number density of particles moving freely in the solution, thus decrease in color. It is to be noted that the particles are not dissolved into the acid medium, a separate experiment was done simultaneously as a control, i.e., the addition of inhibitor in acid solution without carbon steel substrate and the solution kept for 4 h. No change in color is observed confirming that particles are not dissolved in acid medium.
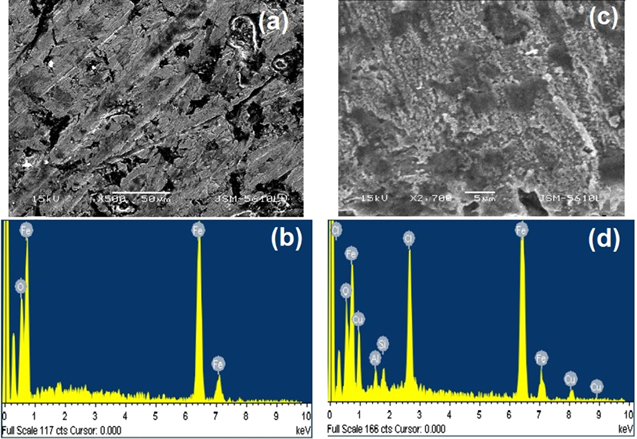
Further verification of the above logic is done by SEM technique to study the surface morphology of the substrate before and after the test experiment. Figure 6 shows the SEM image of the substrate surface, before and after the addition of 51.7 mM MNF inhibitor. The images are recorded after four hours of treatment in 1.0 M HCl. It is seen that the blank substrate has voids with the size of a few tens of micrometer. After treatment with inhibitors, these voids get filled and create a layer on the surface, which protects the substrate from exposure to the harsh environment. As a result, the inhibition efficiency increases with the MNF inhibitor. Thus, the SEM result supports the concept of the formation of nanoparticles film on the steel surface. EDX analysis as shown in table 3 of the substrate before and after treatment adds to this result.
Figure 6. SEM image and EDX of carbon steel substrate (a), (b) before and (c), (d) after 4 h of immersion in 1.0 M HCl solution with 51.7 mM MNF inhibitor in gravimetric method.
Download figure:
Standard image High-resolution image
Table 3. EDX analysis of the mild steel substrate before and after treatment with MNF inhibitor.
| Before treatment | After treatment | |||
|---|---|---|---|---|
| Element | Weight (%) | Atomic (%) | Weight (%) | Atomic (%) |
| O K | 13.27 | 34.81 | 43.44 | 70.44 |
| Fe K | 86.73 | 65.19 | 44.22 | 20.54 |
| Cl K | — | — | 12.33 | 9.02 |
| Totals | 100.00 | 100.00 | ||
5. Conclusion
MNF inhibitor can be used to protect carbon steel under acid attack. The inhibition efficiency increases with an increase in inhibitor concentration until it reaches an optimum concentration. The results of weight loss and polarization curves show that maximum inhibition is achieved at 51.7 mM concentration. The inhibitive action follows the Langmuir adsorption isotherm in HCl medium, whereas Freundlich adsorption isotherm in H2SO4 medium. The observed inhibitive action is due to the adsorption of magnetic nanoparticles on the steel surface, forming a barrier between the metal and the aggressive environment. As the concentration increases, the fraction of steel covered by the adsorbed molecules θ increases, leading to higher inhibition efficiency. Arguments of corrosion inhibition have been devised based on the diminishing color of solution to explain the phenomena which are supported by SEM images.
Acknowledgments
One of the authors (SJ) would like to thank SVNIT for financial support to carry out the experiment.