

Abstract
UH3-type hydrides were formed by hydrogenation of splat-cooled U-based alloys upon applying high H2 pressures (>2.5 bar). Hydrogenation of U1−xMox alloys (with x ⩾ 0.12 (12 at.% Mo) containing the cubic γ-U phase leads to a formation of nanocrystalline β-UH3, why those of U1−xZrx alloys (with x ⩾15 at.% Zr) implies a pure α-UH3. The Curie temperature of hydride (UH3)0.85Mo0.15 reaches 200 K; it may be the first U-based ferromagnet with such high TC. The results reflect the dominant U–H interaction.
Export citation and abstract BibTeX RIS

Original content from this work may be used under the terms of the Creative Commons Attribution 3.0 licence. Any further distribution of this work must maintain attribution to the author(s) and the title of the work, journal citation and DOI.
1. Introduction
Metallic uranium consisting of the orthorhombic α-U phase (at and below the ambient temperature) strongly reacts to hydrogen even at very low pressures (mbar), forming uranium-trihydride (UH3) which is a nasty pyrophoric powder which self-ignites in air [1]. Thus UH3 is considered as a hazard during the storage of uranium metal. On the other hand, due to its high absorption rate, uranium has been used particularly as a storage medium for tritium in the nuclear industry [2]. UH3 itself can be used e.g. as an intermediate in the synthesis of uranium compounds [1].
Beside of the stable orthorhombic α-U phase, two more phases of uranium exist at high temperatures: the tetragonal β-U and cubic γ-U phase formed respectively in the temperature range of 940–1045 K and 1045–1405 K [1]. The cubic γ-U phase can be retained to low temperatures by alloying with transition metals. Such alloys with the cubic γ-U phase have a higher resistance to corrosion and better accommodate radiation damage (than those with α-U phase) and thus they are considered as better materials for nuclear fuels [3].
We have recently succeeded with stabilization of the cubic γ-U phase by alloying with Mo, Zr, Pt, Nb, Ti, Ru in a combination with ultrafast cooling. We have thoroughly investigated the electromagnetic properties of these materials, since they exhibit the superconducting ground state with critical temperature Tc below 2.2 K. Besides, we are interested in underlining the hydrogen absorption ability in these splat-cooled alloys as well as hydrogen influence on the electromagnetic properties. It is known that for the nearest U–U distance, dU–U < 3.40 Å, the U-based compounds have a paramagnetic ground state and are often superconducting at low temperatures, while for dU–U > 3.60 Å they are usually magnetic, accordingly to the Hill limit [4]. Thus we expect that the increase of dU–U upon hydrogenation would lead to an appearance of the uranium magnetism in the hydrides formed from those γ-U phase alloys.
UH3 is the only binary uranium hydride. However, it has two crystal structures denoted as α-UH3 and β-UH3 which are both cubic with a similar crystal densities (11.12 g cm−3 and 10.92 g cm−3 respectively). α-UH3 is a metastable phase formed at relatively low temperatures which slowly converts to the stable β-UH3 phase at high-temperatures. In α-UH3, U atoms (in 2a sites) form a body-centered cubic (bcc) lattice (a = 4.16 Å) and H atoms locate on the faces of the cube. Each U atom is surrounded by 12 hydrogen atoms formed a slightly distorted icosahedrons (with a uranium–hydrogen spacing dU–H of 2.32 Å). The shortest U–U distance in α-UH3 is about 3.60 Å, much larger than that in α-U: dU–U = 2.80 Å). β-UH3 has a much larger unit cell (a = 6.64 Å) containing two different uranium sites: 2 uranium atoms (U1) locate at the bcc sites of the cubic structure (as that of α-UH3 (2a positions)) and other 6 uranium atoms (U2) (formed 3 pairs) on the faces of the cube (the 6c position; i.e. at the positions of hydrogen in α-UH3). The hydrogen-isocahedrons around U1 atoms have the same symmetry as that for α-UH3, while those around U2 atoms (with dU–H = 2.30 Å) are arranged less symmetrically. With respect to the hydrogen atoms, they are located at the center of distorted tetrahedra formed by the uranium atoms. The shortest U–U distance in β-UH3 (between U2 atoms in 6c position) is about 3.31 Å, i.e. much shorter than that in α-UH3 (see table 1). For a most recent review of UH3, see the introduction in [5].
Table 1. Summary of crystal structure (at 300 K) and electro-magnetic properties of selected U-T alloys (T = Mo, Zr especially with cubic γ-U structure) and their hydrides: lattice parameter (a), the shortest U–U atomic distance (dU–U), the superconducting critical temperature (Tc), the critical field (Hc2), Sommerfeld coefficient of electronic specific heat (γe), the ferromagnetic Curie temperature (TC), the spontaneous magnetization (Ms). The data obtained for U-hydrides (α-UH3, β-UH3) were also given for a comparison. The data taken from the literature [6, 20] were denoted with (a).
| a (Å) | dU–U (Å) | Tc (K) | μ0Hc2 (0) (T) | γe (mJ K−2 U−1) | TC (K) | Ms (μB/U) | |
|---|---|---|---|---|---|---|---|
| α-U | 2.80 | 0.65 | 0.3 | 11 | |||
| U0.85Mo0.15 (γ-U) | 3.44 | 3.00 | 2.11 | 6.7 | 18.8 | ||
| U0.85Zr0.15 ((α + γ)-U) | 3.54 | 3.06 | — | — | |||
| U0.70Zr0.30 (γ-U) | 3.54 | 3.07 | 0.8 | 2.2 | 16.9 | ||
| α-UH3 | 4.16 | 3.60 | 170(a) | ||||
| β-UH3 | 6.64 | 3.31(6c) | 28.5(a) | 165–170(a) | 0.9(a) | ||
| (UH3)0.85Mo0.15 (β-UH3) | 6.65 | 3.33 | 34.4 | 200 | 1.15 | ||
| (UH3)0.85Zr0.15 (α-UH3) | 4.14 | 3.58 | ~32 | 185 | 0.90 | ||
| (UH3)0.85Zr0.30 (α-UH3) | 4.14 | 3.58 | 34 | 170 | 0.85 |
Both α-UH3 and β-UH3 are ferromagnets with Curie temperature (TC) in the range of 165–180 K and the uranium magnetic moment of about μU = 0.9 μB/U [6]. We remind here that α-U is a weak Pauli paramagnetic. The crystal structure expansion by hydrogen in UH3 leads to the formation of U magnetic moment. It is explained in the context of a reduction in the overlap of the 5f wave functions between nearest U neighbors implying a reduction of the 5f bandwidth and an increase the density of state at the Fermi level N(EF). Indeed, the Sommerfeld coefficient of the electronic specific heat was found to be γe = 29 mJ K−2 mol−1 for β-UH3 [7], almost 3 times larger than that in α-U (γe = 11 mJ K−2 mol−1) [8]).
Our investigations revealed that all splat-cooled γ-U alloys (e.g. U-15 at.% Mo) are very stable in the ambient hydrogen atmosphere: no measurable hydrogen absorption at atmospheric pressure (1 bar H2) was found. These alloys can absorb hydrogen but only upon applying high pressures higher than 2.5 bars. The formed hydrides (UH3)1−xTx are ferromagnets with enhanced Curie temperature around 180–200 K. The crucial point of our study is that using Zr alloying we succeeded to synthesize the α-UH3 phase (without a transformation to β-UH3) as a pure phase, while using Mo alloying lead to formation of the nanocrystalline β-UH3.
In this work we summarize our investigations of the crystal structure and magnetic properties of the two different UH3 phases in the hydrides formed from splat-cooled γ-U alloys. In order to get a deeper understanding of the properties of the hydrides, we investigated also carefully the properties of their metallic precursors (i.e. the γ-U alloys).
2. Experimental
U-T alloys (T = Mo, Zr, Pt, Nb, Ti, Ru) with low T concentrations (up to 30 at.%) were prepared by arc-melting in argon atmosphere. The splat-cooled sample was prepared from the alloy-ingot by splat-cooling technique. The splat-samples are thin foils (with a thickness of 100–200 μm) and a disc shape (with a diameter of 15–20 mm). More details of preparation of the splats have been reported earlier [8, 9].
We notice that by means of splat-cooling technique with the cooling rate in the range of 106 K s−1, we are able to retain the cubic γ-U phase to the ambient temperature with a reduced necessary amount of the alloying element. For instance, the cubic γ-U phase (with a small tetragonal distortion called γ0-U) without any trace of orthorhombic α-U phase was obtained in the splat-cooled U-11 at.% Mo alloy (i.e. U alloyed with 11 at.% Mo) [8], i.e. several percent of Mo lower than that obtained by a standard furnace cooling (in U-16.5 at.% Mo) [10]. Besides, using the splat cooling we can increase the Pt solubility in γ-U phase up to at least 15 at.% Pt [11] and stabilize this phase (in U-15 at.% Pt) down to room temperature, while the Pt solubility in standard conditions is reported to be only up to 5 at.%. Another advantage is that the thin-foil splats can be used directly for the XRD measurements (the bulk alloys are hard and cannot be crushed into powder). It is also easy for cutting the foils to get proper size samples for other measurements.
For the hydrogenation, the samples were placed in an alumina crucible into a reactor, which could be pressurized to 150 bar of H2 gas. The reactor was first evacuated down to 10−6 mbar and then H2 gas was introduced. We found that minimum H2 pressure for the hydride formation of the U-T splats is about 2.5 bar, irrespective of composition. Higher pressures (up to 100 bar) can only fasten the process, but the absorbed H amount remains the same. The desorption in a closed evacuated volume was performed to determine the total H concentration. The total amount of H2 released corresponds approximately to 3 H atoms per 1 U atom, suggesting that uranium with hydrogen form well-defined structure units, which are only weakly affected by alloying atoms.
Throughout our work, the T-content is given in the atomic percent (at.%). Several types of sample notation have been used. Namely, the alloy with 15 at.% Mo is marked as U-15at.% Mo, or U0.85Mo0.15 or UMo0.18. The hydride formed from hydrogenation of U0.85Mo0.15 is denoted as (UH3)0.85Mo0.15 or UH3Mo0.18.
For the splats, we use the sample pieces with proper sizes required for different measurements. For the hydrides, we use the powder samples.
The sample characterizations and investigations are carried out by means of standard techniques such as x-ray diffraction, closed cycle refrigerator system (CCR), quantum design physical properties measurement system (PPMS) and magnetic properties measurement system (MPMS) in the temperature range of 0.3–300 K and in magnetic fields up to 14 T, described earlier [8, 9].
Phase purity analysis, microstructure study have been performed on several splats by means of x-ray energy dispersive microanalysis (EDX) using the scanning electron microscope (SEM), electron backscatter diffraction (EBSD), transmission electron microscopy (TEM). The splats show in most cases a homogeneous distribution of the alloying elements with concentrations corresponding the nominal ones.
3. Superconductivity of the splat-cooled U-T alloys containing the γ-U phase
In general, increasing the T alloying content (T = Mo, Zr, Pt, Nb) leads to a rapid suppression of numerous α-U peaks and an enhancement of γ-U peaks due to the development of the γ-U phase. Our detail investigations performed on U-Mo system showed that a pure cubic γ-U phase with an ideal A2 structure could be obtained only for U0.85Mo0.15 revealed by single and sharp γ-U peaks without any diffusion in the XRD pattern. EBSD analysis also proved a homogenous γ-U phase [8, 9]. For other element alloying, we have performed the investigations for the T-content in a similar range of 0–15 at.% focusing on the alloys with the same 15 at.% T content. The XRD pattern of U0.85Pt0.15 revealed γ-U type structure with a small trace of α-U phase [11]. For the U0.85Nb0.15 alloy, the splitting of the γ-reflections into doublets indicating a stabilization of the γ0-U phase, i.e. a cubic structure with a small tetragonal distortion [12]. Unlike other T alloying, the dominant α(1 1 0) and α(1 1 1) reflections still persist for U0.85Zr0.15 indicating a co-existence of α-U and γ-U phase. The single γ-U phase can be obtained in U0.70Zr0.30 splat, i.e. at higher Zr content (U-30 at.% Zr). However, a larger broadening of γ-reflections is observed attributed to an additional disorder of Zr atom distribution at such high Zr alloying content. Our recent investigations indicate that alloying with Ti leads to a similar situation, i.e. a co-existence of α-U and γ-U phase in U0.85Ti0.15 and a single γ-U phase but with a large peak-broadening for U0.70Ti0.30. Alloying with 15 at.% Ru leads to a stabilization of the pure γ-U phase revealed by single and sharp γ-U peaks in the XRD pattern of U0.85Ru0.15.
Another clear evidence for the γ-U phase is the negative temperature coefficient of electrical resistivity (dρ/dT < 0) in the normal state. Namely, a weak decrease of the electrical resistivity with increasing temperature was observed, similar to that in strongly disordered alloys and compounds [13, 14]. Despite of some small differences in the absolute values of residual resistivity ρ0 (~ρ4 K) and the room-temperature resistivity (ρ300 K), the relative change of the resistivity with temperature is similar for U0.85T0.15 alloys (T = Mo, Pt, Nb, Ti). The negative slope is attributed to a weak localization, which appears under conditions of strong disorder and which is partly suppressed by electron-phonon scattering. In the case of U0.70Zr0.30 containing the γ-U phase, the negative slope does not develop yet. Instead a positive slope was observed. However, the dρ/dT value is almost close to zero. We expect that the negative slope may develop at higher Zr concentrations than 30 at.%.
All investigated U-T splats become superconducting below 2.2 K. The superconducting transitions revealed by abrupt resistivity drops in zero magnetic field are shown in figure 1. In the pure U splat, the transition is manifested by a single drop at Tc = 1.24 K with a transition width ΔTρ = 0.2 K. The highest critical temperature Tc = 2.11 K and the sharpest resistivity drop at Tc (ΔTρ = 0.02 K) was found for U0.85Mo0.15. U0.85Nb0.15 becomes superconducting at Tc = 1.90 K (with ΔTρ = 0.15 K), i.e. at similar critical temperature as for U-Mo alloys consisting of γ0-U structure with 11–12 at.% Mo alloying. Despite of a similarity in the crystal structure with U0.85Mo0.15, a lower critical temperature and a wider transition (Tc = 1.46 K, ΔTρ = 0.07 K) was found for U0.85Ru0.15. U0.85Ti0.15 becomes superconducting at Tc = 0.99 K. We notice here that U0.85Ti0.15 contains the mixed (α + γ)-U phase. However, only a single drop was observed at Tc. The transition width in this case is quite large (ΔTρ = 0.15 K). The superconductivity in U0.85Pt0.15 is characterized by a sharp drop at Tc = 0.61 K (with ΔTρ = 0.04 K). In fact it is the lowest critical temperature for all investigated U-T splats in our case. In addition, a second small drop was observed at Tc(h) = 0.95 K (with ΔTρ = 0.08 K). We notice here that a complicated phase situation was detected for the U-15 at.% Pt splat at the grain boundaries [11]. Besides, although the XRD patterns did not reveal any reflection characteristic for UPt phase, we cannot exclude its existence. Thus we cannot be conclusive about intrinsic behavior of UPt. We note here that, even if for the U0.95Pt0.05 (U-5 at.% Pt) splat [15] and U0.85Ti0.15 splat consisted of a mixed α-U and γ-U phase, the superconducting phase transition is revealed by only a single drop in the resistivity. More detailed investigations of superconducting phase transition in UPt alloys are in progress. We add in the same figure the data for U0.70Zr0.30 splat consisting of γ-U phase which exhibits a superconducting transition revealed by a single drop at Tc = 0.81 K (with ΔTρ = 0.08 K), for a comparison.
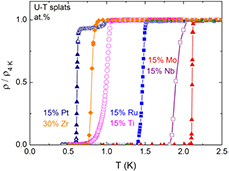
Figure 1. Temperature dependence of electrical resistivity in zero-field of splat-cooled U-T alloys having the γ-U phase around the superconducting transition temperature. For an easier comparison the curves were normalized to respective resistivity values at 1.5–2 K. The pure single γ-U phase U-15 at. % Mo splat has a highest critical temperature (Tc = 2.11 K) and sharpest resistivity drop (ΔTρ = 0.02 K).
Download figure:
Standard image High-resolution imageApplying external magnetic fields, the superconducting transitions shift towards lower temperatures, as expected. The estimated values for critical magnetic fields at zero temperature (μ0Hc) and the critical slopes at Tc of the Hc2 versus T curves (−μ0(dHc2/dT)Tc) are respectively in the range of 2 − 7 T and 2 − 4 T(K).
For most of investigated alloys, only a very small feature (i.e. a weak but non-negligible and broad bump) related to the superconducting transition was revealed in the specific heat at Tc. The pronounced λ-type specific-heat anomaly was observed only for U-15 at.% Mo splat. In this case, the height of the experimentally observed specific-heat jump (ΔC) is in a good agreement with that estimated from BCS theory.
4. Nanocrystalline β-UH3 structure in (UH3)0.85Mo0.15
We have thoroughly investigated hydrogenation of splat-cooled U-Mo alloys. For the low Mo alloying range, e.g. U0.96Mo0.04, for which the alloy consists mostly the orthorhombic α-U structure, hydrogenation had led to a formation of the β-UH3. The advantage of such formed (UH3)0.96Mo0.04 is that it is not pyrophoric (while the β-UH3 formed from a pure uranium specimen is pyrophoric). Thus it is much easier to handle it, e.g. preparation of powder samples for the measurements. Hydrogenation of the bcc phase precursors (U alloyed with Mo concentrations ⩾11 at.%) also lead to the β-UH3 material. Only a few broad diffraction lines were revealed, suggesting amorphous or nanocrystalline state [16]. We show in figure 2 the XRD patterns of U0.85Mo0.15 before and after hydrogenation. The XRD patterns of the precursor, U0.85Mo0.15, exhibit all γ-U reflections. For the (UH3)0.85Mo0.15, several broad peaks were observed which can be attributed to diffraction lines of β-UH3. The lattice parameter is estimated to be a = 6.67 Å, quite close to that of β-UH3 (see table 1). A quantitative analysis shows that the experimental patterns can be well reproduced assuming the broadening related to the small grain size of about 1–2 nm [16].
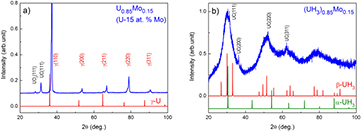
Figure 2. (a) XRD pattern of U0.85Mo0.15 alloy (U-15 at.% Mo) revealed all characteristic γ- reflections of γ-U phase; and (b) XRD pattern of (UH3)0.85Mo0.15 revealed broad peaks attributed to β-UH3. The α-UH3 and β-UH3 diffraction lines are included for a comparison.
Download figure:
Standard image High-resolution imageWe emphasise that, similar to hydrides of several U-rich compounds such as U6CoH18 and U6FeH17, β-UH3 dominates (UH3)0.85Mo0.15. However, the amorphization or nanocrystalline structure induced by hydrogenation was obtained only for (UH3)0.85Mo0.15. In other words, we obtained β-UH3 but it is in a new type: the nanocrystalline β-UH3 structure. We show the microstructure studied by transmission electron microscopy revealing the nanocrystalline state of (UH3)0.85Mo0.15 in figure 3. Such nanocrystalline hydrides with typical grain size of 2 nm are formed for all Mo concentration x ⩾ 0.12, i.e. for the precursor alloys with bcc structure [17].

Figure 3. The microstructure studied by transmission electron microscopy of U0.85Mo0.15 revealing some area of a few nm with contrast variations attributed to nanocrystalline state.
Download figure:
Standard image High-resolution imageThe temperature dependence of electrical resistivity of (UH3)0.85Mo0.15 and its precursor is shown in figure 4. For the hydride for whole temperature, the resistivity weakly decreases with increasing temperature, i.e. with a negative slope (dρ/dT < 0). A pronounced kink appears at T = 200 K, undoubtedly related to a magnetic ordering. The Curie temperature (Tc = 200 K) in this case is about 25 K higher than that of β-UH3, revealing a large enhancement. Besides, upon hydrogenation, the absolute resistivity values increases by more than 10 times. Namely, the absolute value of resistivity of U0.85Mo0.15 at 300 K is 89 μΩ cm, while it exceeds 1000 µΩ cm in (UH3)0.85Mo0.15. We explain it in the context of reduction in concentration of conduction electrons due to hydrogen absorption.

Figure 4. Temperature dependence of electrical resistivity of (UH3)0.85Mo0.15 compared with that of U0.85Mo0.15 alloy (U-15 at.% Mo). A kink at 200 K correlating with Curie temperature TC could be seen clearly in an enlarge scale in the inset.
Download figure:
Standard image High-resolution imageThe temperature dependence of magnetization of (UH3)0.85Mo0.15 indicates the ferromagnetic ordering with the Curie temperature TC close to 200 K. The spontaneous magnetization is estimated to be Ms = 1.15 μB/U, certainly higher than that for β-UH3 (~0.9 μB/U [6, 18]), but much lower than the ionic moments (~3.2 μB for f2 or f3 ground state). Thus it is attributed to the strongly itinerant magnetism of the U hydrides. Our ab initio calculations [19] suggested a depopulation of the U-6d and 7s states. It may be the clue to the 5f band narrowing and strong ferromagnetic features in the hydrides.
The surprising fact is the enhancement of TC in the hydrides of U-based alloys with γ-U phase. It is in contrary with earlier observation revealing that a reduction of the crystallinity implies a suppression of the 5f magnetism in U-based systems [20]. (UH3)0.85Mo0.15 is probably the first U-based ferromagnet with such a high Curie temperature reaching 200 K.
An anomaly is clearly revealed around TC in the temperature dependence of the specific heat of (UH3)0.85Mo0.15, as shown in figure 5. For a comparison, we show also the literature data of β-UH3 [6]. It indicated that the ferromagnetic transition in (UH3)0.85Mo0.15 shifted to higher temperature (i.e. at 200 K compared with that of β-UH3). Besides, a visible peak broadening is observed, attributed to e.g. the grain distribution due to disorder in the sample. The Sommerfeld coefficient of the electronic specific heat can be estimated from the low-temperature part of the specific heat by the Debye model (γe = 29.2 mJ K−2 mol−1, or γe = 34.4 mJ K−2 U−1, see table 1). The increase of γe in the hydride with respect to initial alloy is a clear evidence of an increase of the density of states at the Fermi level attributed to an enhancement of the U–U spacing and consequent narrowing the 5f band.
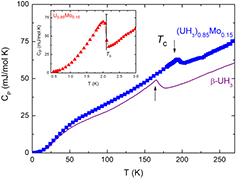
Figure 5. Temperature dependence of specific heat of (UH3)0.85Mo0.15 in a comparison with that of β-UH3 [6]. An anomaly corresponding to a ferromagnetic phase transition was observed at TC = 200 K. The appearance of magnetism upon hydrogenation implies a suppression of the superconductivity revealed by a λ-type of peak at Tc in the precursor of the hydride (in U0.85Mo0.15), as shown in the inset. The bar indicates the expected BCS value for the specific-heat jump at Tc.
Download figure:
Standard image High-resolution image5. Crystalline α-UH3 structure in (UH3)1−xZrx
The atomic radius of Zr (1.60 Å) is larger than that of U (1.56 Å), while that of Mo (1.40 Å) is smaller. Thus Zr doping would imply a lattice expansion and an increase of the shortest inter-uranium distance (see table 1), i.e. an opposite effect to that of Mo doping. Similar to Mo alloying, Zr alloying leads to a rapid suppression of numerous α-U peaks and development of γ-U peaks seen in XRD pattern. However, unlike U-Mo alloys, the γ-U phase can be stabilized in U0.70Zr0.30 splat, i.e. at a much higher Zr content.
U-Zr alloys are very stable at the ambient temperature and ambient pressure. The hydrogen absorption takes place only upon applying high pressure >2.5 bar and single phase hydrides of the type (UH3)1−xZrx are formed [19]. XRD patterns of the (UH3)1−xZrx hydrides as well as of their precursors are presented in figure 6. As examples, we show the data for x = 0.15 (admixture (α + γ)-U) and x = 0.30 (pure γ-U). Unlike the Mo doped hydrides, the XRD patterns for the Zr doped hydrides reveal the crystalline state, which is clearly different from β-UH3. Detailed analysis provides a bcc structure, which is very much expanded (by 75% in volume expansion) with respect to the bcc precursor. The lattice parameters a = 4.16 Å, very close to the α-UH3 structure. A small amount of ZrC impurity was also observed for all hydrides. We remind here that hydride formed from the pure U splat shows an admixture of (α + β)-UH3 in which β-UH3 is a dominant phase. Adding Zr, the concentration of α-UH3 phase was found to increase, while that of β-UH3 decreases. For x = 0.15, only tiny peaks of residual β-UH3 could be observed. For x = 0.20, 0.30, no β-UH3 was observed. The XRD patterns revealed only reflections attributed to α-UH3 without β-UH3 admixture. The peaks, however, are much broader. Detailed analysis indicates a grain size in the range of 10–20 nm, which was in a good agreement with that revealed in the TEM micrograph [16].
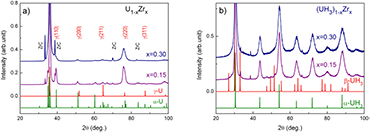
Figure 6. (a) XRD pattern of U1−xZrx alloys (x = 0.15, 0.30, i.e. U-15 at.% Zr and U-30 at.% Zr). A pure γ-U phase is obtained only for x = 0.30. (b) XRD pattern of (UH3)1−xZrx revealed reflections attributed to α-UH3. For a comparison, the α-UH3 and β-UH3 diffraction lines are included.
Download figure:
Standard image High-resolution imageWe remind here again that α-UH3 has never been so far stabilized in a pure form. By hydrogenation of Zr doping alloys with stabilized cubic γ-U phase, we are able to prepare and investigate the pure α-UH3 without any β-UH3 admixture.
The ageing was observed for the hydrides with low Zr concentration, e.g. after one month, the α-UH3 phase in pure-U hydride and in (UH3)0.89Zr0.11 has been partly transformed to UO2. No significant changes have been observed by XRD for hydrides with higher Zr concentrations.
In figure 7 we show the temperature dependence of magnetization (M(T) curves) of (UH3)0.85Zr0.15 in a comparison with those of (UH3)0.85Mo0.15 measured in various fields. It reveals a ferromagnetic ordering with the Curie temperature TC at around 185 K. We found that magnetic properties are indeed similar to α-UH3. Alloying with Zr implies an enhancement of TC (in a comparison with that of α-UH3). However, it is lower than that of the alloy doped with the same 15 at.% Mo content, (UH3)0.85Mo0.15 which contains of β-UH3. The spontaneous magnetization is about 1.0 µB/U (see table 1), similar to that of (UH3)0.85Mo0.15 attributed also to the strongly itinerant magnetism of the U hydrides.
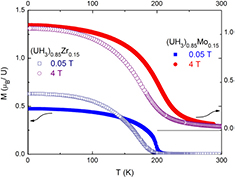
Figure 7. Temperature dependence of magnetization of (UH3)0.85T0.15 (T = Zr, Mo) measured in magnetic field of 0.05 T (in the field-cooled mode) and 4 T.
Download figure:
Standard image High-resolution imageDespite of the difference of TC values in the literature for UH3, it does not excess the value 170 K. The Curie temperatures in (UH3)1−xZrx, however, exceed 170 K. Especially a larger enhancement of TC was observed for (UH3)1−xMox. It even reaches 200 K (see table 1).
In both cases (of Mo as well as Zr doping), the TC dependence on Mo/Zr concentration revealed a maximum around the concentration range of 12–15 at.%. In the β-UH3 structure type with 8U atoms in an unit cell, a periodic replacement of one of U atoms by Mo would yield (U0.875Mo0.125)H3, which is just at about the Mo concentration at which the maximum in TC was revealed (e.g. in (UH3)0.88Mo0.12). However, such a tendency cannot be applied to the Zr system containing α-UH3 structure type (with 2 U atoms in a unit cell), since the maximum appeared at a similar metal content. We notice also that the H concentration was found to be scaled rather with U concentration, but not with metal atoms (i.e. (UH3)1−x formula).
All hydrides exhibit very wide hysteresis loops. As example, the hysteresis loop of (UH3)0.85Zr0.15 measured at 2 K was shown in figure 8 which has a rectangular shape with a width of about 8 T. Increasing Zr concentration from 0 to 30 at.% implies an increase of the width of the loop. It reaches 11 T for (UH3)0.70Zr0.30. Below 6 K, the loops for hydrides of both Zr as well for Mo system revealed erratic steps. For instance, many small Barkhausen-type reproducible jumps (due to domain wall pinning) in the loop have been revealed for (UH3)0.85Zr0.15 in the field range 3–4 T at 2 K. For a comparison we show in the same figure the loop of (UH3)0.85Mo0.15 at a similar temperature (1.7 K), which exhibit a different tendency. Namely, only a single abrupt Barkhausen-type reproducible jump appears between 3.6 and 3.7 T followed by a more smooth increase at higher fields. Besides, all the loops reveal a very slow approach to saturation.
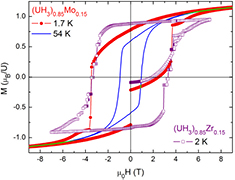
Figure 8. The hysteresis loop of (UH3)0.85T0.15 (T = Zr, Mo) measured at around 2 K. The curves with erratic steps were observed up to 6 K. At higher temperatures a smooth behavior was revealed, as shown as an example the loop at 54 K.
Download figure:
Standard image High-resolution imageThe difference in demagnetization behavior at low temperatures could be in the crystal structure. Namely, in (UH3)1−xZrx with a crystalline structure, the magnetic moments are more collinearly arranged and thus have a higher crystalline anisotropy. As a result, domains have narrow walls and can be easily pinned at the grain boundaries. The remagnetization can happen in many grains at the same time implying erratic steps of magnetization. The situation is difference in (UH3)1−xMox with the nanocrystalline structure and thus with a random orientation of local easy-magnetization directions and with a very small anisotropy. The magnetization processes can be very complicated in this case, i.e. for nanostructured inhomogeneous ferromagnet. It takes smaller magnetic fields to demagnetize the whole sample.
In both cases, the coercive field reaches quite high values al low temperatures, μ0Hc ≈ 4–6 T were found below 3 K. The high magnetic anisotropy is related to large orbital moments in bonding 5f states. At higher temperatures than 6 K, smooth hysteresis loops were observed in all cases. As example, we show also in figure 8 the smooth hysteresis loop observed at 54 K for (UH3)0.85Mo0.15. The main point is that the loop does not reach the reversible behavior even at 12 T.
The specific heat measurements in the temperature range of 0.4–300 K were performed on both hydride samples of Zr doped alloys as well their precursors (UZr alloys). A visible anomaly was observed at around Tc values determined from the electrical resistivity jumps, revealing that the superconductivity in this splat is a real bulk effect. However, unlike the case of U-Mo alloys, no λ-type peaks was observed in splat-cooled UZr alloys, only very broad bumps were revealed. Indeed, the most visible bump observed for of U0.70Zr0.30 alloy is shown in figure 9. The value of the jump amounts to only 30–40% of that expected from BCS theory (marked by the vertical bar in the figure). Only a broader and smaller feature related to TC was observed in the hydride (UH3)1−xZrx. Similar to hydride of Mo doped alloys, an enhancement of the Sommerfeld coefficient of the electronic specific heat was obtaind in the hydride od Zr doped alloys (with respect to initial alloy) indicating an increase of the density of states at the Fermi level due to an increase of the U–U spacing.

Figure 9. Temperature dependence of specific heat of (UH3)0.70Zr0.30 in a comparison with that of β-UH3 [6]. A visible broad peak is observed at the Curie temperature TC. In the precursor U0.70Zr0.30 only a broad bump was revelaed at the superconducting phase transition Tc, as shown in the inset. The bar indicates the expected BCS value for the specific-heat jump at Tc.
Download figure:
Standard image High-resolution image
We notice here that no sign of hydride was observed in XRD patterns after the desorption at 800 °C (1073 K) with a subsequent evacuation of reactor. In other words, the hydride is transformed back to the γ-U phase with a presence of UC and UO2 impurities. In the case of a desorption at 500 °C (773 K), apart from γ-U, UC and UO2, a large portion of the α-U phase was obtained as a consequence of α–γ phase transformation at this temperature.
6. Concluding remarks
Our study indicates that the UH3-based materials can exhibit a large flexibility of the crystal structure and chemical composition. However, beside of some difference in the character of hysteresis loop between Mo and Zr alloyed hydrides (which depends on e.g. grain size) e.g. the unexpected enhancement the ordering temperatures TC, the variations of magnetic properties (such as the U moment and TC) are quite similar. The stoichiometry always corresponds with approx. 3H atoms per 1 U atom. We suggest that uranium and hydrogen form well defined structure units, which are only weakly affected by alloying atoms and that the U–H interaction may play a dominant role instead of U–U separation and related band effects.
Hydrogenation of Mo doped alloys with cubic γ-U phase implies a formation of a new structure form of β-UH3, the nanocrystalline structure. The pure crystalline α-UH3 structure with any admixture β-UH3 has been formed and thus can be studied for the first time by hydrogenation of Zr doped alloys with γ-U phase. Despite of different crystal structure and inter-U spacing, the electronic and magnetic properties of α-UH3 are very similar to those of β-UH3.
It is still not clear if such hydrides formed from γ-U alloys can be considered as novel materials for hydrogen storage applications. However, in the context of practical application, our study indicates an easy route for producing the γ-U alloys in a powder form: by a combination of hydrogenation, followed by crushing of the brittle hydrides into powders and then by hydrogen desorption (of the powders) in a vacuum.
Acknowledgments
The work was supported by the Czech Science Foundation under the grant No. 15-01100S. Experiments were performed at MLTL (http://mltl.eu/) supported within the program of Czech Research Infrastructures (No. LM2011025). Participation of Krakow group was supported by the program MOBILITY 7AMB14PL036 (Czech-Polish bilateral cooperation). We express our thanks to all colleagues, in particular our PhD students from Prague and Krakow (Ilya Tkach, Mykhaylo Paukov, Volodymyr Buturlim, Magdalena Krupska, Sylwia Sowa), who have performed the experiments in the scope of our 'splat-cooling' and hydride project.