

Abstract
A fast and efficient one-pot synthesis of thiol-terminated poly(vinylpirrolidone-co-maleic anhydride-co-ethylene glycol dimethacrylate) based heterobifunctional polymer (PTVP) has been developed. The polymer was used for the modification of quantum dots (QDs) to prepare water soluble and stable QDs with emission quantum yield as high as 80%. Using carbodiimide method, PTVP-capped red light-emitting QDs were conjugated to model monoclonal antibodies specific to glycoprotein B (gB) of Aujeszky's disease virus (ADV) and successfully used in the lateral flow assay (LFA) for the detection of ADV gB in biological fluids. A comparative analysis of the sensitivity of the method was carried out using three types of QDs emitting in the red and far-red region.
Export citation and abstract BibTeX RIS

Original content from this work may be used under the terms of the Creative Commons Attribution 3.0 licence. Any further distribution of this work must maintain attribution to the author(s) and the title of the work, journal citation and DOI.
1. Introduction
Colloidal quantum dots are promising nanoparticles with unique optical properties [1–4]. They can be used as light sources, field-effect transistors, fluorescent labels and barcodes in among other applications [4–10]. In biomedical research quantum dots (QDs) are used for visualization of biological objects including localization of cancer or virus-infected cells, for photodynamic therapy [4, 11–15], as fluorophores in molecular sensors, biochips and lateral-flow immunoassays [16–19].
QDs with the near infrared (NIR) emission range are particularly important, because NIR light is poorly absorbed by the components of body tissues and markedly distant from the autofluorescence of biological materials [20–22] and nitrocellulose, which is the basic material of test strips for immunochromatography [23].
The use of QDs as fluorescent labels requires the solution of two interlinked problems: the formation of the hydrophilic capping of nanocrystals with appropriate groups to ensure their water-solubility, and conjugation with biomolecules [24]. Advantages and disadvantages of different approaches to the solution of these problems were discussed in a number of reviews [25–30].
An overall strategy of the fabrication of water-soluble QDs includes the substitution of original hydrophobic ligands (alkylphosphines, alkylphosphine oxides and others) by ligands, which have, on the one hand, chemical groups capable of binding to the surfaces of nanocrystals (thiol, amine, phosphine, carboxyl, pyridine), and, on the other hand, hydrophilic groups for good water solubility (e.g. hydroxyl). An alternative approach is based on the preservation of the original ligands and implies formation of a shell of amphiphilic molecules or polymers with hydrophobic groups attracted to the original ligands and hydrophilic groups providing water solubility. However, such shells are typically not sufficiently stable, when subjected to biological media [30, 31].
It should be noted, that monodentate ligands, such as thiols, are readily available, but chemically unstable due to oxidation of –SH groups; this eventually leads to QDs aggregation. Contrariwise, bi- and polydentate thiols provide long-term stability of QDs [32]. Carboxyl-terminated ligands provide stability at high pH, while amine-terminated ones are stable in low pH media; silicon oxide and polymer/phospholipid membranes provide less toxicity and stability over a wide pH range but increase size of QDs from 4–10 nm to 20–30 nm, which makes impossible their use in Förster resonance energy transfer (FRET) detection [32, 33]. A variety of multidentate ligands is known including peptides, oligomeric phosphines, hydrophilic polythiols containing polyethylene glycol (PEG), amino or carboxyl groups. Mattoussi used a low molecular weight polyacrylic acid functionalized with methoxy, amino, azido, thioctic and PEG groups [36]. In the work, fragments of dihydrolipoic acid, obtained from thioctic acid by reduction, provided efficient interactions with QD surface, PEG ensured water solubility, while amino and azide groups were used for further functionalization.
Two main parts are present in the structure of most of the QD ligands: the anchor group(s) and hydrophilic group(s). Many ligands also contain a third functional group for conjugation with biological molecules. Synthesis of the heterobifunctional ligands is typically a multistaged process that includes polymerization followed by a series of chemical transformations (acylation, reduction and others) [34–39]. Accordingly, the search of simple synthetic routes to produce ligands is a significant problem.
The ideal ligand for biological applications of QDs must meet the following criteria: (1) high affinity to the surface of QDs; (2) colloidal stability in a wide range of pH and salt concentration; (3) small hydrodynamic diameter; (4) minimal nonspecific binding to biological molecules; (5) minimum toxicity; (6) affordability (commercial availability or ease of synthesis); (7) the functional groups available for bioconjugation and (8) minimal immunogenicity [19, 24].
Conjugation of QDs to biopolymers can occurs electrostatically, through the biotin-avidin interaction, covalently (e.g. activated with carbodiimide binding of amino and carboxyl groups, catalyzed maleimide linking with amino and sulfhydryl groups, linking between aldehyde and hydrazine functions), binding via the polyhistidine-tag [40, 41]. Carbodiimide conjugation method is simple and versatile. However, conjugation may change the optical properties of the QDs and the biochemical activities of conjugated enzymes and antibodies [42].
Therefore, there is a need for development of ligands for QDs that maximally fulfill the above criteria. It is important that a synthetic approach is simple and cost efficient. To satisfy this urgent need, we report here a one-pot synthesis of polythiol ligand, and demonstrate its practical utility by modification of QDs surface, conjugation with antibodies and further testing on LFA test strips.
2. Experimental
2.1. Materials and methods
Trioctylphosphine (TOP, tech, 90%), N-hydroxysuccinimide (NHS, 98%), rhodamine 101 (99%), oxazine 170 perchlorate (95%), magnesium phthalocyanine (90%), 4,4ʹ-azobis(4-cyanovaleric acid) (ABCVA, 98%), superose 6 prep grade were purchased from Aldrich. N-vinyl-2-pyrrolidone (VP, 99%), ethylene glycol dimethacrylate (EGDMA, 98%), N,N-dimethylformamide (DMF, 99%), tetramethylammonium hydroxide pentahydrate (TMAOH, 99%), triethylamine (TEA, 99%) were purchased from Acros Organics. Maleic anhydride (MAN), N-(3-dimethylaminopropyl)-Nʹ-ethylcarbodiimide hydrochloride (EDC, 98%) were purchased from Fluka. Tetrahydrofuran (THF, 99.9%) was purchased from Scharlau. 1,6-hexanedithiol (HT, 97%) was purchased from SΛFC. Tris(hydroxymethyl)aminomethane (Tris, ultra-pure), polyvinylpyrrolidone K 30 (PVP) were purchased from MP Biomedicals. Agarose LE 2 was purchased from Helicon. All other reagents were of chemically pure grade. Monoclonal mouse antibodies (Ab) specific to glycoprotein B (gB) of Aujeszky's disease virus were kindly provided by Institute of Cell Biophysics [43]. Antibodies were purified using anion exchange chromatography as described [44]. Deionized water (DI water) was obtained using Millipore filtration system. IR spectra were measured using a FTIR spectrometer Nicolet 6700. UV–Vis absorption spectra were obtained using an Agilent Cary 5000. Photoluminescence (PL) spectra were obtained using HORIBA FluoroLog. Hydrodynamic (HD) diameters of nanoparticles and weight average molecular weight (Mw) of polymers were measured by Malvern Zetasizer S (Malvern). 0.05 М Tris or phosphate buffered saline (PBS) were appended as solvent media. Zeta-potential of nanoparticle were measured by Malvern Zetasizer Z. The pH values were measured using a HI 211 pH meter from Hanna Instruments. Agarose gel electrophoresis was conducted using a mini-sub cell GT apparatus from Biorad (Richmond, CA). Centrifugation was performed using an Eppendorf 5417R microcentrifuge from Brinkmann Instruments (Westburry, NY).
QDs CdSe/CdS/ZnS (600 nm) were synthesized according to the procedures reported earlier [45–47]. QDs CdTeSe/CdS/ZnS (640 nm) and CdTeSe/CdS/CdZnS/ZnS (680 nm) were synthesized according to our previous publication [48] using 1% mol and 3% mol of Te in core composition. The outer ZnS shell was prepared using a single precursor method [49]. After synthesis, the nanocrystals were coated with hydrophobic ligands.
Photoluminescence quantum yield (PLQY) was determined according described procedure [50] using appropriate organic dye (rhodamine 101 for QDs 600 nm, oxazine 170 perchlorate for QDs 640 nm and magnesium phthalocyanine for QDs 680 nm).
2.2. PTVP synthesis
A 250 ml three-neck flask was charged with 15 ml of VP (140 mmol), 5 g (51 mmol) of MAN in mixture of 10 ml of acetic acid and 15 ml of THF. MAN was dissolved under stirring and then 0.66 g (2.4 mmol) of ABCVA was added. Mixture was flushed with argon and refluxed for 15 min under stirring. Then 2 ml (10.6 mmol) of EGDMA and 0.3 g (1.2 mmol) ABCVA dissolved in 20 ml of THF was added by syringe to above mixture. After 10 min of additional refluxing the reaction was quenched by addition of HT (15 ml, 102 mmol) in 20 ml of THF after 10 min at reflux. Then heater was removed and solution cooled down to room temperature. About 3 volumes of diethyl ether were added for mixture and precipitate of PTVP was formed. Polymer was separated by centrifugation at 10 000 g and dissolved in DMF. Dissolution/precipitation cycle was repeated twice and obtained white powder was rinsed with diethyl ether. Following vacuum drying led to 7.7 g of PTVP (chemical yield ~35%).
2.3. PTVP characterization
Copolymer was characterized by FTIR spectra using Shimadzu—1800S spectrometer on CaF2 pellets in the range of 800–4000 cm−1. Elemental C/H/N/S analysis was performed on elemental analyzer CE1106 by Carlo Erba Instruments. The weight percentages were C, H, N, S: 52,17; 6,61; 7,56; 1,57, respectively. SD = ±0.5% abs.
2.4. QDs hydrophilization
Briefly, 4 g of PTVP was dissolved in 10 ml of 30% DMF in THF. Colloidal solution of 1 g trioctylphosphine/trioctylphosphine oxide (TOP/TOPO) capped QDs in 10 ml of CHCl3 was slowly added to above mixture under fast stirring. After 1 h at 25 °C a saturated solution of TMAOH in DMF containing 10% of water was dripped thereto until opacity occurred. Stirring of reaction continued for 1–1.5 h and then flakes of PTVP capped QDs appeared. Stirring was stopped and precipitate was separated by centrifugation at 10 000 g. After two washes with diethyl ether QDs were dried under vacuum and dissolved in deionized water to give clear colloidal solution. Concentrations of prepared QDs samples were calculated using the method presented by Yu et al [51]. For mixed CdTeSe cores extinction coefficient was estimated using weighted coefficients for pure semiconductors CdSe and CdTe as follows:

where ECdTeSe is experimentally determined energy of the first peak of exciton absorption of CdTeSe, ECdSe and ECdTe are calculated energies for pure CdSe and CdTe with the same size QDs respectively. Thus, weighting coefficients reflects contribution of each type of semiconductor with considering of energies proximity to pure ones.
2.5. Purification of QDs and their conjugates by gel-filtration
Size-exclusion chromatography was performed on superose 6 sorbent using manufacturer's suggested protocol. 10 ml of sorbent was used per 100 mg of sample. Elution was performed using 5 mM TEA at 1 ml min−1 for QDs-PTVP and phosphate buffere saline (PBS) pH 8.0 for QDs-PTVP-Ab. We discarded about 15% of initial fluorescent volume and about 20% of latter fractions. Detection of fluorescence was obtained using a hand-held UV lamp. The collected QDs or QDs bioconjugates solution was filtered with a syringe filter (0.22 µm) to remove gel fragments and the sample was stored at 4 °C prior to further analysis.
2.6. Agarose gel-electrophoresis
QDs-PTVP of different types and QDs-PTVP-Ab conjugates were analyzed using 0.4% agarose gel-electrophoresis. The electrophoresis conditions were Tris/borate/ethylenediaminetetraacetate buffer (0.5× concentrate, pH 8.0) at 70 V for 20 min. Fluorescence images of the gel were obtained using BioRad Gel Doc XR (Hercules, CA) with UV light.
2.7. Covalent conjugation of quantum dots to proteins
The conjugation of protein with purified QDs-PTVP using 1-ethyl-3-(3-dimethylaminopropyl)carbodiimide (EDC) was conducted. NHS was also added into the reaction at the final concentration of 1.5 mM since NHS has been known to stabilize the EDC intermediate [52] but the concentration of NHS was not changed in the reaction. Briefly, the 500 µl of 3 µM QDs-PTVP solution was mixed with NHS first and then EDC was added to the reaction mixture. After approximately 15 min, a 2 µM solution of Ab was added, followed by incubation in the dark for 2 h at 25 °C with gentle shaking. Excess of active species was neutralized by addition of 100 µl Tris (10 mM). All conjugation reactions occurred at pH 7.5 in PBS buffer, followed by purification by either gel-filtration or gel-electrophoresis as mentioned above. Additional control in same conditions without Ab was performed.
2.8. Preparation of cell lysate and gB-antigen
BHK-21 cells were from the Cell Culture Collection of Vertebrates (St. Petersburg, Russia). The cells were maintained in Dulbecco's modified eagle's medium (DMEM) (HyClone) supplemented with 10% FCS (HyClone). ADV strain K from the collection of viruses of the Bio-Test-Laboratory (Kiev, Ukraine) was used for the experiments. BHK-21 cells were infected with the virus at a multiplicity of 2–4 PFU per cell and incubated for 24 h at 37 °C. For the preparation of cell lysates, the uninfected and ADV-infected cells were treated with 1% Triton X-100 for 1 h at 37 °C, the solution was clarified by centrifugation for 20 min at 10 000 g. The gB-antigen was purified by immunoaffinity chromatography as described [53]. The purity of gB was assessed using sodium dodecyl sulfate polyacrylamide gel electrophoresis (SDS-PAGE) performed using the method of Laemmli [54]. The concentration of gB in the cell lysates were determined by the gB-specific two-site 'sandwich' assay [43] using purified gB-antigen for creation of calibrating curve.
2.9. Preparation of LFA strips
Glycoprotein B (gB)-specific antibodies (clone 34/2) were immobilized on a nitrocellulose membrane backed on a polyester card (HiFlow Plus 180, Merck-Millipore, Darmstadt, Germany). The detection zone consisted of a test line and a control line. For the preparation of the test line, gB-specific monoclonal antibodies (MAb) 34/2 were brought to a concentration of 1 µl cm−1 in phosphate buffered saline (PBS) and dispensed on the membrane at a rate of 1 l cm−1 using a BioJet XYZ 3000 Dispenser (Biodot Inc., Irvine, CA, USA). The control line was prepared using rabbit anti-mouse IgG antibodies. The membranes were dried, soaked in PBS containing 1% bovine serum albumin (BSA) (PBS-BSA), washed in PBS containing 0.05% Tween 20 (PBS-T), stabilized in PBS containing 2% sucrose (PBS-S), and dried. The cards were assembled so that the glass fiber sample pad, the glass fiber conjugate pad, and the absorbent pad (Merck-Millipore, Darmstadt, Germany) were attached to the gluecovered plastic support, and all the membranes and filters lightly overlapped in order to allow a continuous lateral flow of the liquid sample. The cards were cut into 4-mm strips using an automatic programmable cutter CM4000 (Biodot Inc., Irvine, CA, USA).
2.10. gB-LFA procedure
The assay was performed in the 'wet' format without drying the gB-directed QD conjugates. The ADV gB was diluted with the assay buffer (PBS-BSA-T containing 0.2% Triton X-100 and 3% BSA). The diluted samples in a volume of 30 µl (contains 200 ng of ADV gB) were mixed with gB-directed QD conjugates and pipetted onto the sample pad. After 10 min, 30 µl of assay buffer was pipetted on the sample pad and allowed to migrate for further 10 min.
2.11. Evaluation of results
In order to obtain quantitative results of LFA, the intensities of the control lines and background were measured using fluorimeter equipped with solid-sample holder accessory. Integration of PL signal was performed in the range λem ± 0.5 FWHM, where λem is QDs emission maximum and FWHM is corresponding full width at half maximum as it is shown in table 2. Repeated measurements of the samples were carried out after irradiation by UV light (312 nm) 225 mW cm−2 in 1–160 min time range.
3. Results and discussion
We realized a multistage one-pot synthesis for heterobifunctional ligand, which provides water-solubility, colloidal stability, biocompatibility, simple conjugation with QDs with proteins. We used copolymer of N-vinylpyrrolidone (VP) with maleic anhydride (MAN) as starting materials. VP and MAN can easily react to produce water soluble and biocompatible copolymers [55, 56]. First, we synthesized copolymer of VP and MAN (copolymer 1, figure 1) in the presence of the initiator 4,4ʹ-azobis(4-cyanovaleric acid) (ABCVA) followed by addition of ethylene glycol dimethacrylate (EGDMA) as a branching agent in reaction mixture without isolation of the intermediates.

Figure 1. Scheme for synthesis of PTVP.
Download figure:
Standard image High-resolution imageFollowing addition of an excess of 1,6-hexanedithiol (HT) leads to the radical thiol-ene reaction with remaining double bonds forming thiol-containing residues of the copolymer. Further modification of QDs and hydrolysis in an aqueous medium in the presence of tetramethylammonium hydroxide (TMAOH) as the strong base produced free carboxyl groups that could be used for further conjugation with proteins. Remarkably, the whole process takes less than 1 d. Thus, proposed synthetic approach is several times faster than the recently published state-of-the art procedures [34–36, 57].
It should be noted that the optimized polymerization conditions led produced only minimal yellowing of the final products. Yellowing was significant in case of increased amount of MAN and in the absence of acetic acid as a part of solvent mixture. Corresponding absorption spectra (PTVP 1 and 2) are shown in supporting information (see figure S1 (stacks.iop.org/ANSN/9/015002/mmedia)). The colored byproduct could be the anionic form of MAN, and its formation was negligible in presence of acetic acid.
IR spectrum of the copolymer in comparison with the spectrum of PVP is shown in figure 2.
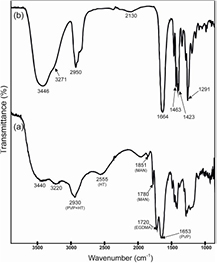
Figure 2. IR spectra of PTVP (a) and PVP (b).
Download figure:
Standard image High-resolution imageIn the PTVP spectrum the following characteristic absorption maxima were observed (cm−1): PVP 1653, –С=О [56]; НТ 2555, –SH [58]; MAN 1780, 1851, –С=О [59]; EGDMA 1720, –С=О [60]; this indicates that all four reactants were included in the polymer. The average hydrodynamic diameter (measured by dynamic light scattering) of the resulting polymer was 1.7 nm, and Mw (measured by static light scattering) was 4.4 ± 0.4 kDa. Size distribution of PTVP in comparison with PVP 40 kDa is shown in figure S2 (see supporting information). Results of elemental analysis revealed the 22–26 moieties of VP, 1–2 НТ, and from 7 to 10 of the sum of MAN and EGDMA residues.
Formation of polymer-coated water soluble QDs was accomplished in two stages. At the first, initial TOP/TOPO ligands were substituted by PTVP in THF/DMF/CHCl3 mixture. After stirring at room temperature for about 30 min, excess of concentrated base (TMAOH) solution was added to the reactor. Successive stirring of the above-mentioned mixture led to flocculated precipitate of QDs. After centrifugation supernatant was discarded and precipitate was rinsed by THF to remove low Mw byproducts. Residue was dispersed in DI water. Principal scheme of QDs hydrophilization is shown in figure 3.
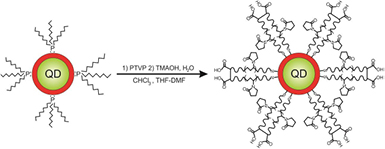
Figure 3. Scheme of QDs hydrophilization.
Download figure:
Standard image High-resolution imageOnly very small amount of aggregates was formed (less than 10%) under condition of synthesis, and they were easily removed by centrifugation. Thus, these procedures are very simple and fast and gives water soluble QDs with good yield.
The size distribution of QDs-PTVP was determined by dynamic light scattering (figure S2). The average hydrodynamic diameters of the resultant particles in comparison with intrinsic diameter of semiconductors represented in table 1.
Table 1. Physical properties of QDs.
| Quantum dots | Diameter |
Hydrodynamic diameter of PTVP capped QDs/ζ-potential |
Hydrodynamic diameter of QDs-PTVP-Ab/ζ-potential |
|---|---|---|---|
| CdSe/CdS/ZnS (600 nm) | 7.5 | 16/−40 | 43/−17 |
| CdTeSe/CdS/ZnS (640 nm) | 11.5 | 24/−39 | 39/−25 |
| CdTeSe/CdS/CdZnS/ZnS (680 nm) | 9.5 | 18/−35 | 30/−17 |
aCalculated in accordance of number of shell monolayers confirmed by TEM [51, 53]. bMeasured at pH 8.0 in PBS.
The optical properties of QDs were fully unchanged after hydrophilization, except the small diminution of PLQY, which is the maximum for QDs with emission at 600 nm (see table 2 and figure 4). Probably, the quantum yield decreased in the case of short-wave QDs due to the absorption of the PTVP at the shorter excitation wavelength (520 nm). This wavelength was used for rhodamine 101 fluorescent standard when we tested PLQY of 600 nm emitting QDs. QDs with emission at 640 nm and 680 nm was measured using oxazine 170 perchlorate and magnesium phthalocyanine as standards (corresponding to maximum cross section with QDs emission spectra). When wavelength was increased, the absorption of the polymer became insignificant, and, therefore, it did not affect PLQY of the QDs with longer wavelength emission, which were exited above 550 nm.
Table 2. Fluorescent properties of QDs.
| Quantum dots | Emission maximum (nm) | PLQY of QDs before/after hydrophilization (%) | PLQY of QD-PTVP-Ab conjugates (%) | FWHM |
|---|---|---|---|---|
| CdSe/CdS/ZnS | 600 | 84/55 | 61 | 33 |
| CdTeSe/CdS/ZnS | 640 | 71/70 | 64 | 35 |
| CdTeSe/CdS/CdZnS/ZnS | 680 | 83/80 | 45 | 45 |

Figure 4. Optical properties of QDs after hydrophilization.
Download figure:
Standard image High-resolution imageThe data concerning ζ-potential of hydrophilic QDs is shown in table 1. There is a substantial negative charge on particles at pH 8.0 in PBS, which indicates the stability of the colloidal dispersion under these conditions [61]. It should be noted that dispersions maintained they colloidal and optical properties for more than 6 months at room temperature.
In addition, QDs-PTVP was characterized by agarose gel-electrophoresis (figure 5(a)). The analysis shows clearly that all QDs have similar electrophoretic mobility. This data is in a good agreement with the measured sizes and charges of the particles (see table 1).

Figure 5. (a) Agarose gel-electrophoresis of PTVP covered QDs of the following emission wavelengths: 600 nm (1), 640 nm (3), 680 nm (5) and corresponding QDs-PTVP conjugated with antibodies (Ab) (2), (4), (6). (b) Agarose gel-electrophoresis of products of conjugation between QDs-PTVP 680 nm and Ab with different ratios QDs:Ab:EDC. (1)—unconjugated QDs-PTVP (control); ratios of QDs:Ab:EDC was (2) 1:5:1000; (3) 1:5:2000; (4) 1:10:100; (5) 1:10:500; (6)1:10:1000; (7) 1:10:2000.
Download figure:
Standard image High-resolution imageTo demonstrate the ability of functionalized QDs to couple to amino-containing biomolecules, PTVP-capped red light-emitting QDs were conjugated to model monoclonal antibodies specific to glycoprotein B (gB) of Aujeszky's disease virus (ADV).
Conjugation was performed by the carbodiimide method using N-(3-dimethylaminopropyl)-Nʹ-ethylcarbodiimide hydrochloride (EDC) and N-hydroxysuccinimide (NHS) as described earlier [62]. In order to optimize coupling procedure, different ratios QDs:Ab:EDC were used for the conjugation. The conjugation efficiency was evaluated by gel-electrophoresis in the agarose gel (figure 5(b)). Hydrodynamic diameter of conjugates is shown in table 1, see also figures S2(d), (f) and (h). The formation of conjugated QDs-MAbs was accompanied by a shift of electrophoretic mobility; the shift was not observed without Ab (figure S3). Highest electrophoretic homogeneity of products and the lack of unconjugated QDs-PTVP was obtained at the Ab:QDs ratio of 10:1 and QDs:EDC ratio of 1:2000. The shift in electrophoretic mobility of conjugates decreased in the series QDs 600 nm > QDs 680 nm > QDs 640 nm which correlated with the sizes of the QDs-PTVP. A larger particle size corresponds to a larger area of its surface, which leads to fewer changes in its properties after conjugation. Conjugation has no significant effect on the PLQY of QD-PTVP except that for QD 680 nm (table 2).
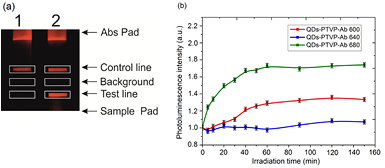
To demonstrate the applicability of QDs-PTVP as a fluorescent label in LFA, QDs-PTVP-Ab conjugates based on MAbs directed to ADV gB were used for the detection of ADV gB. The ADV gB was detected by the two-site 'sandwich' LFA in the lysate of ADV-infected cells. Conjugates with different fluorescence peaks were used in the assay. In the presence of 200 ng ADV gB, a fluorescence appeared in the test line area (figure 6(a), line 2). To quantify the results, a ratio of integral fluorescence intensity of test line to that of the background was used. The values of 1.27, 2.77, and 2.67 were obtained for the conjugates with emission peaks of 600 nm, 640 nm, and 680 nm, respectively. Thus, the conjugates QDs-PTVP-Ab with fluorescence maximum in a range of 640–680 nm were most suitable in LFA for the detection of ADV gB since the background intensity in this area of spectrum is low [48].
Figure 6. (a) Photo of the LFA test strips with QDs-PTVP-Ab conjugates, an example for QDs emitting at 680 nm. (1) control without ADV gB, (2) the sample containing 200 ng of gB antigen. (b) Photostability of PL signal under the conditions of prolonged UV irradiation for different type of conjugates.
Download figure:
Standard image High-resolution image
Since the photostability of QDs-PTVP-Ab conjugates is important for the LFA, we evaluated the fluorescence of the conjugates irradiated by UV for a long time. It was demonstrated that fluorescence intensity did not decrease for several hours of UV irradiation. Moreover, we observed an increase of the intensity in the case of the QDs-PTVP-Ab conjugates emitting at 680 nm (figure 6(b)). A possible explanation of this observation is that this type of QDs demonstrated a considerable decrease in quantum yield in the conjugation process (table 2). This can be related with particular etching of the surface of semiconductor. Perhaps, under the action of UV these defects are partially cured. The best stability of the analytical signal was observed for the QDs 640 nm.
4. Conclusion
We developed time-effective one-pot synthetic procedure for a copolymer of VP, MAN and EGDMA with pendant thiol groups. The ligand can be used to produce water soluble QDs with good chemical yield and high PLQY. Copolymer was used for the functionalization of CdSe/CdS/ZnS, CdTeSe/CdS/ZnS, CdTeSe/CdS/CdZnS/ZnS QDs. High colloidal stability of PTVP-modified QDs was shown using ζ-potential measurement. Hydrophilic PTVP-capped QDs were conjugated with monoclonal mouse antibodies and demonstrated optical properties similar to QDs-PTVP. The conjugates, of particular those emitting in the far-red spectrum, demonstrated highly specific activity in the two-site LFA in the detection of ADV gB. We hope that the developed method will be used in a great variety of analytical applications.
Acknowledgment
This work was supported by the Russian Science Foundation (grant № 15-19-00229).