

Abstract
This report highlights the results of the preparation of semiconductor CdTe quantum dots (QDs) in the aqueous phase. The small size of a few nm and a very high luminescence quantum yield exceeding 60% of these materials make them promisingly applicable to bio-medicine labeling. Their strong, two-photon excitation luminescence is also a good characteristic for biolabeling without interference with the cell fluorescence. The primary results for the pH-sensitive CdTe QDs are presented in that fluorescence of CdTe QDs was used as a proton sensor to detect proton flux driven by adenosine triphosphate (ATP) synthesis in chromatophores. In other words, these QDs could work as pH-sensitive detectors. Therefore, the system of CdTe QDs on chromatophores prepared from the cells of Rhodospirillum rubrum and the antibodies against the beta-subunit of F0F1–ATPase could be a sensitive detector for the avian influenza virus subtype A/H5N1.
Export citation and abstract BibTeX RIS

Content from this work may be used under the terms of the Creative Commons Attribution-NonCommercial-ShareAlike 3.0 licence. Any further distribution of this work must maintain attribution to the author(s) and the title of the work, journal citation and DOI.
1. Introduction
Because of the high surface-to-volume ratio and the quantum confinement effect, nanocrystals (NCs) of semiconductors, or quantum dots (QDs), have become interesting objects for both fundamental research and practical applications. In the past two decades, significant advances have been made towards the synthesis of colloidal semiconductor QDs, particularly II–VI compounds, such as CdSe, CdS and CdTe [1–5]. These highly luminescent nanomaterials possess suitable characteristics for various applications in optoelectronics and biological labeling [3–16]. Recently, with the development of gene technology and relying on the basic mechanism for antigen recognition by a specific antibody, along with the production of protons by ATP during the antigen–antibody reaction, semiconductor QDs have been stepped up in their application in the early-stage diagnostics of some viral diseases [11, 12]. Among II–VI semiconductor compounds, CdTe has attracted much interest because it is a direct gap material with a bandgap energy of 1.52 eV, which is suitable for emitting in the visible spectral range by controlling the size correspondingly with the quantum confinement of charge carriers. Moreover, compared to CdSe, from the literature, it seems that one could produce CdTe QDs in the aqueous phase more easily. This sounds very significant for bio-labeling applications, including the labeling of tumor cells, the sensing of drug delivery and the detection of residual pesticides [13–16]. For fluorescence biolabeling using semiconductor QDs, one should classify clearly the different types corresponding to their sophisticated structure and sensitivity. The simplest is just to bind luminescent QDs on the surface or inside the cells (e.g. yeast cells) then observe their emission under a microscope. Specific labeling is much more complicated, where an antigen is specifically recognized by its corresponding antibody that has been attached to the luminescent QDs. The highest-sensitivity detection is realized by some biosensor structures in which one can measure the change in fluorescence intensity or electrochemical signal with the specific interaction of an antibody with an antigen. For the use of semiconductor QDs as fluorescent tags for biomedical applications, such as imaging, drug delivery, nanomedicine, and in vitro and in vivo biological labeling, however, potential toxicity and clearance of semiconductor QDs in biological systems is of concern. Some publications carried out on the toxicity and clearance in vitro and in vivo of CdTe and CdHgTe QDs in human cancer cells showed that both CdTe and CdHgTe QDs are cytotoxic to human breast and prostate cancer cells but were cleared from the site of injection over a sufficient period of time [17].
In general, the as-synthesized QDs are covered by ligand molecules. Depending on the polarization of these ligands, the QD–ligand complex could be dispersive in water or not. CdTe QDs are normally covered by mercaptopropionic acid (MPA) or mercaptosuccinic acid (MSA), with the COOH end and the SH end out. Both ends make the complex CdTe QDs/MPA (or MSA) easily dispersed in water. For CdSe QDs, many authors have performed the syntheses in high boiling temperature organic solvents, like tri-n-octylphosphine oxide (TOPO), tri-n-octylphosphine (TOP) and/or amines [18–20], or a non-coordinating solvent like 1-octadecene (ODE) [21, 22]. As-prepared CdSe NCs generally show weak luminescence because of the existence of non-radiative channels originating from surface states. After appropriate passivation by shelling with the CdS, ZnSe and/or ZnS monolayers [23–25], these core/shell QDs become highly luminescent. However, after carrying out ligand exchange to produce water-soluble CdSe QDs, the luminescence reduces significantly.
In this paper, we present the results for the syntheses of semiconductor CdTe and CdTe/CdS QDs in aqueous phase [26–28]. By a systematic check of the variation of each technological parameter, namely the molar ratio of Cd:Te:MPA and the pH value of the reaction solution, we have determined the optimal set of the mentioned technological parameters for producing the best quality CdTe and CdTe/CdS QDs. In order to characterize the structural phase and optical properties of the obtained samples, we used x-ray diffraction (XRD), absorption and photoluminescence (PL), including the temperature-dependent PL measurement. To test the pH-sensitive characteristics of CdTe QDs, different pHs ranging from 4 to 9 were prepared by adding a mixture of MPA and 1 M NaOH into the same bottles of twice distilled water. The strong two-photon excitation PL is also presented, showing good characteristics for biolabeling without interference with the cell fluorescence. For orientation to the application in targeting/specific biolabeling, the primary results for the pH-sensitive PL from CdTe QDs are presented in that the fluorescence of CdTe QDs was used as a proton sensor to detect proton flux driven by ATP synthesis in chromatophores. The system of CdTe QDs on chromatophores prepared from the cells of Rhodospirillum rubrum and the antibodies against the beta-subunit of F0F1–ATPase could be a sensitive detector for the avian influenza virus subtype A/H5N1.
2. Experimental
2.1. Synthesis of CdTe core
The chemical substances for the synthesis of CdTe QDs are sodium borohydride (NaBH 4, 99%), tellurium powder (Te, 99.8%), thiourea ((NH 2)2 CS, 97%), cadmium bromide (CdBr 2, 99%), and 3-mercaptopropionic acid (MPA, 99%). They were purchased from Merck and Aldrich. All chemicals were used without additional purification.
The synthesis of CdTe QDs is as follows. First, stock NaHTe solution must be prepared by putting 160 mg of Te powder and 100 mg of NaBH 4 into a two-neck flask and degassing for 30 min, and then backfilling with nitrogen gas; and then, adding 2 ml of degassed distilled water into the flask. To promote the reaction mixture, an ultrasonic generator is applied for 30 min at a temperature of ∼50–60 °C. As a result, a deep red transparent solution is formed via the following chemical reaction,

For the next step, to produce typical CdTe QDs, 12.5 mM of CdBr 2 solution is mixed with 18.75 mM of MPA solution at a ratio of Cd:MPA=1:1.5 (mol/mol) and the pH of this solution is adjusted in the range of 7–12 by the addition of 1.0 M NaOH solution. After that, the freshly prepared 0.625 M NaHTe solution is injected quickly by a syringe into the Cd-containing flask at room temperature under nitrogen gas protection. The reaction mixture changes instantly to golden yellow, indicating the nucleation of CdTe nanocrystals. The as-prepared CdTe QDs emitted very weak luminescence, peaking at around 510 nm.
2.2. Synthesis of CdTe/CdS core/shell structure
To passivate surface dangling bonds and stabilize the photophysical characteristics of CdTe QDs, we made the shell over the CdTe core by adding an excessive amount of thiourea into the solution containing the CdTe QD core. Then, this mixture was annealed at 120 °C in a autoclave for certain periods of time depending on the required sizes of the CdTe/CdS. Herein, thiourea was used as the sulfur source due to its decomposition at high temperature, and the S 2− ions could easily combine with the excessive Cd 2+ ions in the initial solution to form CdTe/CdS core/shell structures. During the shelling from a few minutes to few hours, not only the CdS shell formed but also the CdTe core became bigger, corresponding to the emission at longer wavelengths.
2.3. Structural and optical characterizations
The powder XRD patterns were taken by using a Siemens D5000 powder X-ray diffractometer equipped with graphite monochromatized high-intensity Cu Kα radiation (λ=1.541 78 Å). The TEM images were taken by a TEM system (Tecnai 20ST, Osaka University, Japan).
The absorption and PL spectra were obtained by using a Cary 5000 (Varian) UV-vis-NIR spectrophotometer and iHR550 (Horiba) spectrometer equipped with a thermoelectrically cooled Si-CCD camera (Synapse), respectively. In the PL measurement, a 377 nm LED was used as the excitation source and lasers of 1064 nm and 980 nm were used for the two-photon excitation PL measurement. The room temperature PL QY of the prepared samples was estimated by comparing the total integrated emission of the samples with that of the QY-known Rhodamine 6 G (∼95%) at the same optical density. For the temperature-dependent PL measurement (in the 15–300 K range), a sample was prepared in the form of a thick, close-packed QDslayer on Cu substrate, which was mounted on the cold finger of a closed-cycle helium cryostat (APD Cryogenics DE202A).
2.4. Preparations of bio-materials
For the purpose of the development of a biosensor for the H5N1 virus detection, we have prepared the necessary materials, including a chromatophore, anti-F0F1-β-subunit antibodies and anti-H5N1 antibodies. The chromatophore was extracted and purified from Rhodospirillum rubrum [29,30]. The β-subunit of F0F1-ATPase from thermophilic bacterium Bacillus PS3 was expressed in E. coli BL21 (DE3) and purified according to the procedure reported in [31]. The antibody against the β-subunit of F0F1-ATPase was prepared according to [32] and purified by precipitation with 33% (NH 4)2 SO 4 followed by Protein A-Sepharose and stored at −20 °C until use. Anti-H5N1 antibody was produced via the following protocol. H5N1 virus was purified as described in [11] and used to immunize a rabbit for antibody production. The immunization was repeated 4 times (150 μg protein for each) at 1 week intervals. One week after the last dose, the total blood was collected from the injected rabbit and the antibody was purified by precipitation with 33% (NH 4)2 SO 4 followed by Protein A-Sepharose.
3. Results and discussion
CdTe QDs were synthesized with different technological conditions, namely in different pHs of reaction solution and different molar ratios of Cd:Te:MPA [33]. The optimal conditions for producing the highest quality CdTe QDs were determined to be pH 7–8 and a Cd:Te:MPA molar ratio of 2:1:(2–3). Figure 1 shows the typical powder XRD pattern of CdTe NCs synthesized for 5 min at 120 °C, in which the peaks at the diffractive angles of 24.16°, 40.31° and 46.82° correspond to the cubic zinc-blende CdTe. In principle, due to the minimum energy requirement of certain assembles of atoms, the balance between the surface barrier energy and the atom-packaged energy must be set. The cubic structure is the case to compromise; moreover, this structure has a higher symmetry than the hexagonal one, and is easier to understand for the system of a few nanometers of a small number of atoms. Thus, nano-sized cubic CdTe QDs were formed instead of hexagonal ones. The clear diffraction peaks indicate that the CdTe QDs were well crystallized.
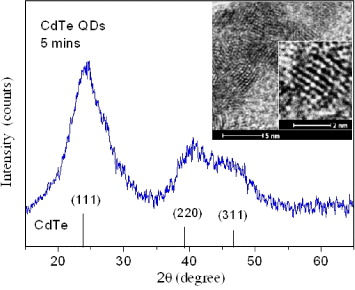
Figure 1 Powder XRD pattern of CdTe NCs synthesized for 5 min at 120 °C, showing the cubic CdTe. The inset is a high-resolution TEM image of a NC with clear atomic layers.
Figure 2 shows the absorption and PL spectra of typical CdTe QD samples synthesized in the same Cd:Te:MPA molar ratio equal to 2:1:3 and pH 7 at 120 °C, except the change of the growth/shelling time for 5, 90, 150 and 360 min. It is clear that the CdTe QDs synthesized emit rather strong luminescence.

Figure 2 Absorption and PL spectra of the typical CdTe QDs synthesized in the same Cd:Te:MPA molar ratio of 2:1:3 and pH 7, at 120 °C; (a), (b) and (c) correspond to the growth/shelling time of 90, 150 and 360 min, respectively.
It seems that the PL only originates from the excitonic transition with rather large localization energy causing a large Stokes shift. The origin of different Stokes shifts in different QD systems is still questionable. However, it must be related to the surface states and ligands of the QDs. Therefore, in many cases, it is not fully suitable to study the optical transitions by using only the one-photon with the energy higher than the 1S 3/2–1Se transition energy to excite the QDs. In such a case, photo-generated carriers could be captured at surface states and ligands and then lost their energy.
After shelling with CdS, typically luminescence QY, determined by relative measurement in comparison with Rh6G, was as high as 60% up. Moreover, these QDs can stay in the colloidal state for years without any change or precipitation. To understand better the optical transitions in the obtained CdTe/CdS QDs, we performed a temperature-dependent PL measurement and a two-photon excitation PL. Figure 3 shows the temperature-dependent PL spectra taken from close-packed CdTe/CdS QDs. In general, almost electronic transitions could relate more or less to the lattice vibrations. Therefore, there is also a question whether in a very small assembly of atoms to form nanocrystals the contribution of the microfield induced by lattice vibrations is still taking place, giving rise to the red-shift of emissions with increasing temperature. The microfield-induced bandgap narrowing normally takes place in the bulk crystal, causing about 80% of the bandgap change with temperature, while the 20% left is the contribution of the thermally-induced change to the lattice constants [34, 35]. Figure 3 gives the answer to this query; it presents the red-shift of the PL spectra of the CdTe/CdS QDs with increasing temperature. Thus, some characteristics taking place in bulk materials could happen even in a very small assembly of atoms in nanocrystals, e.g. the effects of bandgap narrowing with temperature and donor–acceptor pair recombination [36]. Not only the red-shift of the PL spectra with increasing temperature but also a normal tendency of the decrease in the PL intensity with increasing temperature was observed. The latter is because of the lattice vibration population increases, causing an increase in the interaction of carriers with lattice vibrations to reduce the probability of the radiative transition. Figure 4 presents the two-photon excitation PL spectra. One can see that an interesting feature of the two-photon excitation PL spectra is the PL peaking at higher energy than that taken from one-photon excitation. Maybe traps or surface states have been skipped out in the transition after two-photon excitation. For the PL spectrum taken with the 1064-nm light excitation, only one emission band was observed, while for the 532 nm excitation, both emission bands corresponding to the 370 nm (one-photon) excitation and the 1064 nm excitation were observed. This needs more study of the corresponding transitions. Getting the two-photon excitation PL is good because of the practical requirement in biolabeling to avoid the self luminescence from the living cell with high enough energy excitation. For the two-photon with low-energy excitation, it is more convenient to avoid the self-luminescence from living cells beside the QD PL. In such a case, one can benefit also the volumetric effect, meaning that the excitation can go through the cell to excite QDs distributed deep inside the cells.
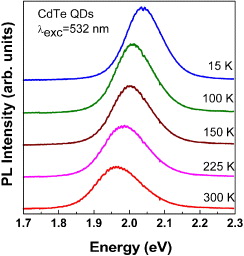
Figure 3 Temperature-dependent PL spectra taken from close-packed CdTe/CdS QDs.
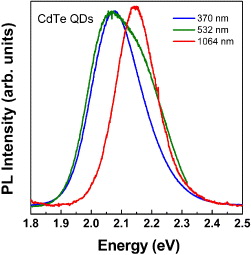
Figure 4 Two-photon excitation PL spectra of colloidal CdTe/CdS QDs.
Recently, the use of CdTe QDs in labeling viruses through pH-change detection have been reported [11, 37, 38]. The technique uses many advantageous properties of oligonucleotide-functionalized F0F1–ATPase within a chromatophore for the purpose of capturing even a single virus based on an antibody–antigen reaction. The principle of the detection is based on the production of protons (H + ions) via the reaction of antibodies of β-subunit of F0F1–ATPase. This realization of a kind of the pH-sensitive CdTe QD detector was presented in figure 5 of [11], in which the fluorescence of CdTe QDs was used as a proton sensor to indicate proton flux driven by ATP synthesis in chromatophores. In other words, when the F0F1–ATPase synthesized ATP, the velocity of the proton pump could be reflected by measuring the fluorescence changes of QDs labeled on the outer surface of chromatophores. Therefore, the system of CdTe QDs on chromatophores prepared from the cells of Rhodospirillum rubrum and the antibodies of the β-subunit of F0F1–ATPase could be a sensitive detector for the avian influenza virus subtype A/H5N1. To step up the application of synthesized CdTe/CdS QDs in real biosensors, we have realized the production of the β-subunit and antibody against the β-subunit of F0F1–ATPase, and the anti-H5N1 antibody. These are very important steps to realize the biosensors for sensitive/specific virus detection. Also, the pH-sensitive indication via the PL intensity from CdTe/CdS QDs has been checked. Figure 5 shows the change in PL intensity from CdTe/CdS QDs as a function of pH. In these experiments, a series of water-based solutions with various pHs ranging from 4 to 10 were prepared by adding a certain amount of MPA to the pH-10 solution or by adding a certain amount of 1 M NaOH to the pH-4 solution. The same amounts of 1 ml of the mentioned solutions were used to carry the amount of 100 ml of diluted colloidal CdTe/CdS QDs solution.
Figure 5 The change in PL intensity from CdTe/CdS QDs as a function of pH.
4. Conclusion
In conclusion, we have prepared highly luminescent CdTe quantum dots in the aqueous phase with different sizes corresponding to different emissions in the green-deep red spectral region. The technological parameter set for producing the best quality CdTe and CdTe/CdS QDs has been determined to be the Cd:Te:MPA molar ratio=2:1:3 and pH 7. At a growth/shelling temperature of 120 °C, the growth/shelling times of 5, 90, 150 and 360 min are necessary for producing QDs that emit at 513 nm, 557, 572 and 610 nm, respectively. These nanomaterials are very promisingly applicable to bio-medical fluorescence labeling, even with two-photon excitation using various long wavelength excitation sources, such as 1064 nm and 980 nm. The primary results for the pH-sensitive CdTe QDs are presented in that the fluorescence of CdTe QDs was used as a proton sensor to detect proton flux driven by ATP synthesis in chromatophores. In other words, these QDs could work as pH-sensitive detectors. Therefore, the system of CdTe QDs on chromatophores prepared from the cells of Rhodospirillum rubrum and the antibodies against beta-subunit of F0F1–ATPase could be a sensitive detector for the avian influenza virus subtype A/H5N1.
Acknowledgments
This work was partially supported by the National Independent Project of Basic Research for Applications, and the National Foundation for Science and Technology Development (NAFOSTED Vietnam, code 103.03.35.09).