
Abstract
Nanocrystalline alloys have attracted wide attention because of their excellent soft magnetic properties such as high saturation induction and permeability, low magnetostriction, coercive field and anisotropy. In this paper, the nanocrystalline material is prepared by annealing a melt-spun Fe73.5Si13.5Cu1B9Nb3 amorphous ribbon with various annealing conditions. This annealing process produced a series of samples with different crystalline fractions. The primary crystallization stage was investigated by cryogenic heat capacity and x-ray diffraction. The x-ray diffraction results showed that the sample began to crystallize at 490 °C and nanocrystalline Fe3Si particles were formed in all the annealed samples. The crystalline fraction obtained by the cryogenic heat capacity measurement indicated that the crystalline volume fraction can be controlled by selecting the annealing temperature or annealing time. The crystallization process is almost complete (99.31%) when the sample is annealed at 600 °C for 60 min.
Export citation and abstract BibTeX RIS

Content from this work may be used under the terms of the Creative Commons Attribution-NonCommercial-ShareAlike 3.0 licence. Any further distribution of this work must maintain attribution to the author(s) and the title of the work, journal citation and DOI.
1. Introduction
Nanocrystalline Fe-Si-B-Cu-Nb alloy, known as FINEMET, has attracted much interest because of its excellent soft magnetic properties [1–5]. These properties include very high saturation magnetization (∼1.3 T), low coercivity H C (∼0.5 A m −1), low saturation magnetostriction (∼2×10⁻⁶) and high effective permeability μ(∼105). FeSiCuNbB alloy is derived from the conventional Fe-Si-B system with minor additions of copper (Cu) and niobium (Nb). Yoshizawa et al [1] reported that the best soft magnetic properties are achieved when the Cu concentration is at a level of one per cent or a little higher, the best of which has the composition Fe 73.5 Cu 1 Nb 3 Si 13.5 B 9 at%. The nanocrystalline material is prepared by annealing a melt-spun Fe 73.5 Si 13.5 Cu 1 B 9 Nb 3 amorphous ribbon at temperatures in the range 520–600 °C [6, 7]. The best soft magnetic properties are achieved after annealing for 60 min at 550 °C [8–10]. Annealing at higher temperatures leads first to the precipitation of borides and subsequently to grain coarsening, both of which deteriorate the soft magnetic properties [3, 7].
The soft magnetic properties of Finemet alloys are significantly improved due to particles of nanocrystalline α-Fe(Si) dispersed in a residual amorphous matrix. The resulting microstructure is characterized by randomly oriented, ultrafine grains of bcc Fe-20 at% Si with typical grain sizes of 10–15 nm embedded in a residual amorphous matrix which occupies about 20–30% of the volume and separates the crystallites at a distance of about 1–2 nm [3–6]. The formation of this particular structure is ascribed to the combined effects of Cu and Nb (or other group IV to VI elements) and their low solubility in bcc Fe: copper promotes the nucleation of the bcc grains, while niobium hinders their growth and at the same time inhibits the formation of boride compounds [5, 7].
Many investigations of the crystallization of the nanocrystalline Fe-B-Si-Cu-Nb alloys have already been published [11, 12]. Different techniques including x-ray diffraction (XRD), thermal gravimetry analyzer (TGA), different scanning calorimetry (DSC) and extended x-ray absorption fine structure (EXAFS) are commonly used to investigate the crystallization behavior of the alloys. All these techniques allow identification of phase compositions and estimation of the crystalline fraction, but it is very difficult to evaluate small changes in the amount of crystalline phase. Many methods and techniques have been used to examine the behavior of nanocrystallization. To observe the microstructure directly, high resolution transmission electron microscopy (HRTEM) was used [13]. However, it is very difficult to prepare samples for HRTEM observation and this method requires expensive equipment. A method for determining the crystal fraction using thermal analysis (TA) was also used [14]. However, the exact enthalpy is difficult to determine because of the structural relaxation during heat treatment. The cryogenic heat capacity measurement gives another method to evaluate the quantity and quality of phase compositions, i.e. the crystalline or amorphous phases of materials. This method has the advantage over HRTEM and TA methods because it can measure non-destructively and the samples are simply prepared. For this reason, cryogenic heat capacity was selected as the primary technique for studying the primary crystallization stage of the nanocrystalline Fe-B-Si-Cu-Nb alloys. The heat capacity studies were supplemented with x-ray diffractometry (XRD).
2. Experiment
Fe 73.5 Cu 1 Nb 3 Si 13.5 B 9 amorphous ribbons 5 mm wide and about 25 μm thick were prepared by a conventional rapid solidification technique. In the present work, in order to study the primary crystallization stage, as-spun ribbons were annealed in various conditions. The resulting annealed samples are listed in table 1.
Table 1. The conditions of heat treatment for the Fe 73.5 Cu 1 Nb 3 Si 13.5 B 9 samples.
| A0 | As-quenched | |
| A1 | 490 | |
| A2 | 520 | |
| A3 | 530 | 60 |
| A4 | 540 | |
| A5 | 550 | |
| A6 | 600 |
The structures of the as-quenched and annealed samples were investigated by x-ray diffraction using a SHIMADZU XRD-6000 diffractometer. X-ray analyses were performed using Cu Kα radiation (λ=0.154051 nm) at 40 kV and 30 mA. The scanning speed was 0.02° s −1 from 30° to 90° in scan θ/2θ.
The crystallization behavior of as-quenched and annealed samples was investigated by cryogenic heat capacity (CHC). The cryogenic heat capacity of the samples was measured from 15 to 40 K using an adiabatic calorimeter in a high vacuum. The principle of the calorimeter is based on the Nernst stepwise heating method. Details of the cryogenic heat capacity measurement system can be found elsewhere [15, 16].
3. Results and discussion
X-ray analysis is carried out for the investigated samples and provides information about different crystalline phases as well as on the values of structural parameters, like the lattice parameter or crystalline grain size. Figure 1 shows the x-ray diffraction patterns of the as-quenched and annealed samples. The XRD pattern of the as-quenched sample A0 in figure 1 has a very broad peak around the diffraction angle 2θ=45°. This analysis clearly shows that no evidence of any crystalline peak is observed, and only a characteristic amorphous halo is present. The pattern corresponding to the sample annealed at 490 °C shows a shift in angle and also slight sharpening compared with the as-quenched pattern. This indicates that the crystallization process has begun. The crystallization was more evident in the diffraction pattern of the sample annealed at higher temperature. Sharp peaks were detected for annealed samples A2 to A6. XRD profiles for samples A1 to A6 shown in figure 1 exhibit three major diffraction lines corresponding to the (220), (400) and (422) reflection of the face-centred cubic (fcc) Fe 3 Si of DO 3 type. Besides Fe 3 Si, no other phase was identified according to the x-ray diffraction results. In these samples the structures consist of crystalline Fe 3 Si phase embedded in a residual amorphous matrix. The crystallite size of the Fe3Si particles was estimated by x-ray peak using the Scherrer equation [14]

where λ is the wavelength, θ is the glancing angle and FWHM is the full-width at half-maximum of (220) reflection of the Fe 3 Si phase. The average crystallite size of the annealed samples is about 20 nm.

Figure 1 The x-ray diffraction patterns of Fe 73.5 Cu 1 Nb 3 Si 13.5 B 9 alloys in the as-quenched state and samples annealed for 60 min at 490, 520, 530, 540, 550 and 600 °C.
The crystallization behavior of the measured samples was investigated by cryogenic heat capacity. The heat capacity of the as-quenched and annealed samples was measured at different temperatures between 15 and 40 K.
In the standard adiabatic method for heat capacity measurement, an amount of heat, ΔQ , is furnished at a given temperature to a system leading to a discrete temperature step, ΔT. For small temperature changes, ΔT , the heat capacity, C, of the system is defined by the formula

If it is considered a quasi-static and isobaric process, then it is possible to re-write the heat capacity as follows:

where C is the heat capacity at constant pressure, P, T, V and S, respectively, are the pressure, temperature, volume and entropy of the system. It is easy to observe that the heat capacity of a given system is proportional to its entropy. Therefore, a more disorderly system will be characterized by a higher heat capacity. In this case, the existence of an amorphous phase together with a crystallized phase within a material increases the disorder and the related heat capacity C amorphous >C crystal [15]. C amorphous is the heat capacity at constant pressure for an amorphous solid and C crystal is the corresponding value for the perfect crystalline solid at a given temperature T. It is possible to write the following expression:

where x is the amount of crystalline phase, C,
C
amor
and C
cryst
are the total specific heat of the samples, the heat capacity of the amorphous phase and of the crystalline phase, respectively. Thus, the crystal fraction can be estimated by solving this equation. In equation (
Figure 2 shows the results of the heat capacity for the as-quenched and annealed samples after subtracting the measured addenda and dividing by the sample mass. The dotted line in figure 2 was the Fe3Si lattice specific heat calculated from the Debye's theory using a Debye temperature of 501.1 K [16]. These curves are in agreement with Debye's theory which predicts the heat capacity behavior ∝T 3 law.
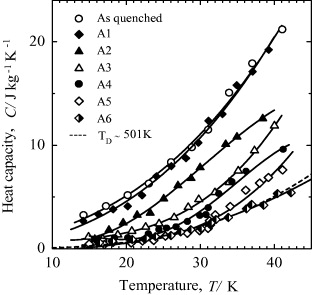
Figure 2 The experimental heat capacity of Fe 73.5 Cu 1 Nb 3 Si 13.5 B 9 alloys in the as-quenched state and samples annealed at temperature 490, 520, 530, 540, 550 and 600 °C for 60 min.
In figure 2 it is clear that the heat capacities of the annealed samples were lower than those of the as-quenched sample A0. The difference between the specific heat of as-quenched and annealed samples is mainly due to the lattice heat capacity of the crystalline phase.
Table 2 shows the volume fraction of the amorphous and crystalline phases, calculated using equation (
Table 2. The fraction of amorphous and crystalline phases of annealed samples.
| A1 | 15.96 | 84.04 |
| A2 | 50.39 | 49.61 |
| A3 | 77.81 | 22.19 |
| A4 | 89.06 | 10.94 |
| A5 | 94.46 | 5.54 |
| A6 | 99.31 | 0.69 |
From figure 3, we can see the increase of the crystalline fraction with increasing annealing temperature.

Figure 3 The dependence of crystalline fraction on annealing temperature of Fe 73.5 Cu 1 Nb 3 Si 13.5 B 9 alloys.
4. Conclusions
The primary crystallization stage of nanocrystalline Fe 73.5 Cu 1 Nb 3 Si 13.5 B 9 alloys was investigated by cryogenic heat capacity and x-ray diffraction. The main conclusions of the present paper are summarized as follows.
- Nanocrystalline materials were obtained by annealing an amorphous Fe 73.5 Cu 1 Nb 3 Si 13.5 B 9 sample at various annealing conditions.
- From the x-ray diffraction measurement, the as-quenched sample has the characteristic amorphous phase. The nanocrystalline Fe 3 Si particles were formed in all the annealed samples.
- The crystal fraction of annealed samples was calculated from cryogenic heat capacity measurement. It increases with the increase of annealing temperature. The crystallization process is almost complete (99.31%) when the sample is annealed at 600 °C for 60 min (sample A6).
Acknowledgments
The authors would like to thank the Laboratory of Amorphous and Nanocrystalline Magnetic Materials, Hanoi University of Technology for kindly providing the material samples used in the present study.