


Abstract
Electrohydrodynamic jet (E-jet) printing is an advanced printing technique using an electric field to create the flow of inks from a nozzle via electrohydrodynamics. This technique can deliver very small droplets or flows of inks for high resolution printing. Here, we describe the fabrication of an anode functional layer for an electrolyte-supported solid oxide fuel cells using E-jet printing technique. An ink containing nickel oxide and 10% scandia-stabilized zirconia (10ScSZ) was used to print on an electrolyte plate. Different printing parameters were investigated to vary the structure and morphology of the printed layer. A multiple anode functional layer was fabricated following the optimal printing parameters. The results showed that the thickness of the lines of the printed grid-structured layer could be altered by changing the printing speed. In addition, the grid interval could be easily adjusted. Moreover, multiple overlapped grid layers could be quickly fabricated by printing another layer on a printed dried layer. This anode structure is very beneficial for fuel cell since it possesses a high porosity for quick diffusion of fuel gas and an increased active surface area for enhancing electrochemical reactions. The results showed that the open-circuit voltage (OCV) values of both cells were approximately 1.1 V although the anode functional layer fabricated by using E-jet printing was 7–10 times thinner than that using screen printing.
Export citation and abstract BibTeX RIS
1. Introduction
In the recent decades, emerging energy and environmental problems such as pollution, fossil fuel depletion and global warming are of global concern for society and scientists. Therefore, clean and renewable energy sources are urgently demanded [1]. Solid oxide fuel cell (SOFC) is an electrochemical energy conversion device that produces electricity with high efficiency via the electrochemical reaction of a fuel with an oxidant (commonly oxygen). This device offers a promising way of producing clean electricity from various kinds of fuel, not only hydrogen but also hydrocarbon, biogas, and biodiesel [2–5]. SOFCs are typically comprised of a dense electrolyte layer sandwiched between two porous electrodes constituting anode and cathode. The oxidation reaction of fuel occurs at the anode, generating electrons which travel through the external circuit to the cathode for the reduction of oxygen. The oxide ions generated at the cathode are then diffused through the solid electrolyte layer to the anode to complete the electrochemical reaction [6]. Based on the cell support, SOFCs can be divided into three types including electrolyte-supported, anode-supported, and cathode-supported cells. Since the oxidation of fuel occurs at the anode, the anode structure is very important that must facilitate the diffusion of fuel gas into the anode and of reaction products out. In addition, the anode must have a high active surface area and numerous reaction sites for the electrochemical reaction [7]. In electrolyte-supported SOFCs, the anode is fabricated on a thick plate of electrolyte served as cell support. Various techniques have been used for anode fabrication such as screen printing, tape casting, spraying, spin coating, and dip coating [8–11]. In order to improve performance of SOFCs, attempts have been made to optimize the structure of anodes. For example, anodes with dual layer structure have been developed [12, 13]. The structure consists of an outer current collector layer with coarse particles, and an inner anode functional layer adjacent to electrolyte layer with fine particles. The current collector layer has a high porosity to facilitate quick diffusion of fuel gas and reaction products. Electrochemical reaction occurs mainly in the anode functional layer where the use of small particles helps to maximize number of reaction sites (triple phase boundaries). A thicker anode functional layer will have more reaction sites for the electrochemical reaction. However, a too thick layer will make the gases difficult to diffuse due to the low porosity of this layer, thus decreasing the performance of the fuel cell [14].
Electrohydrodynamic jet (E-jet) printing is an advanced printing technique. This technique uses an electric field to create the flow of inks from a nozzle via electrohydrodynamics [15]. In the printing system, a voltage is applied between the nozzle and an opposing conducting support. A back pressure is used to deliver ink from a syringe to the tip of the nozzle to form a pendant meniscus of ink on the tip. Under the applied electric field, the mobile ions in the ink are accumulated to regions near the surface of the meniscus. Coulombic repulsion between these ions deforms the meniscus into a conical shape known as the Taylor cone. At a sufficiently high electric field when the electrostatic force overcomes the surface tension, droplets of ink are ejected from the cone and deposited onto the substrate [16–18]. In this technique, the jetted flow of ink can be much smaller than the diameter of the nozzle that allows high resolution printing. E-jet printing has found various applications in fabricating microelectronics, sensors, photonic devices, and printing of biomolecules [19–22].
In this paper we report for the first time use of E-jet printing technique for fabrication of a novel anode functional layer for an electrolyte-supported SOFC. The layer was fabricated by printing the anode material on an electrolyte plate to obtain a grid structure. Various printing parameters such as applied voltage, printing speed, grid interval have been changed and investigated in order to alter the structure and morphology of the printed layer. In addition, multi-layer structures were fabricated by printing another layer on a printed dried layer. This type of grid-structured anode functional layer is expected to have various advantages compared to the continuous layers fabricated using the conventional methods (e.g. screen printing) in terms of gas diffusion, active surface area, and number of reaction sites. Moreover, the grid structure can help to minimize cracking and delaminating of the electrode caused by thermal expansion mismatch during the operation of SOFCs at high temperature. Besides, we also made another anode functional layer by using screen printing method and characterized for comparison.
2. Experimental
2.1. Preparation of an anode ink
8.0 g nickel oxide (NiO) powder and 6.4 g scandia-stabilized zirconia (ScSZ) were thoroughly mixed with ethanol using ball milling for 24 h. After milling, the mixture was filtrated and dried in an oven at 80 °C for 24 h. Then, a mixture of 6 wt% α-terpineol and 94 wt% ethyl cellulose was added into the milled NiO and ScSZ powder and stirred consecutively to form an anode paste. The paste was finely grinded using a triple roll mill for 30 min The viscous anode paste whose viscosity measured by M-VROC viscometer (US) with 530 cp was used as the ink for the next printing steps.
2.2. Fabrication of anode layers using E-jet printing and screen printing
Typically, the Scandia stabilized zirconia electrolyte plate with the thickness of 0.25 mm was mounted onto the stage of the E-jet printer (PSjet-300-V, Printing Solution, Korea). A syringe containing about 1.0 ml ink was mounted onto the printer. A back pressure was used to deliver ink from the syringe to a nozzle connected to the syringe. The height from surface of the electrolyte plate to the tip of the nozzle was 300 μm. The printing process was carried out at various applied voltage, printing speed, and grid interval. The optimal parameters at which the printed lines were not defective were applied to the next steps. The first printed layer was then dried at 100 °C for 2 h. Subsequently, the second, the third and the fourth layers were perpendicularly printed on the previously printed dried layer to form a multi-layer structured anode functional layer (figure 1). Finally, the dried layers were then sintered at 1300 °C for 3 h.
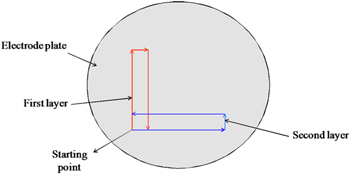
Figure 1. The programming printing process used in the E-jet printing.
Download figure:
Standard image High-resolution imageOn the other hand, the screen printing method with 80-mesh pore size, 125-micro thickness was also used to make a comparison with E-jet printing method.
To investigate the effect of anode on microstructure and electrochemical performance, a cell with a separately fired anode was also prepared. As shown in figure 2, the first printed layer with 56:44%wt NiO: ScSZ was then dried at 100 °C for 2 h. Subsequently, the second were printed on the previously printed dried layer and at 100 °C for 2 h and then sintered 1300 °C for 3 h. The process was carried out similarly with cathode side with the percentage 50:50 wt% LSM:ScSZ. Finally, a pure lanthanum strontium manganate (LSM) current collector ink was screen printed and fired at 1200 °C for 1 h.
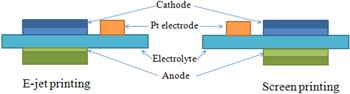
Figure 2. The diagram of cell by using E-jet printing and screen printing.
Download figure:
Standard image High-resolution imageThe anode functional layers derived from E-jet printing and screen printing process were characterized by using an optical microscope (MX51, Olympus), 3D optical profilometry microscope (Sensofar, Spain), and a field-emission scanning electron microscope (FE-SEM, Hitachi SU8010, Japan).
2.3. Electrochemical characterization
To get the electrochemical performance, fuel cell evaluation system (Auto-SOFC, TOYO, Japan) was applied. After reduction process of NiO at the temperature 1000 °C for 1 h, I–V measurement was conducted by means of current interruption method in hydrogen fuel with flow rate of 80 ml × min−1 in the anode, and air at a flow rate of 150 ml × min−1 in the cathode side.
3. Results and discussion
3.1. Particle size of the ink particles
The particle size of the powder for the printed ink was characterized by FESEM. As shown in figure 3, the size of the ink particles was approximately from 50 to 150 nm.
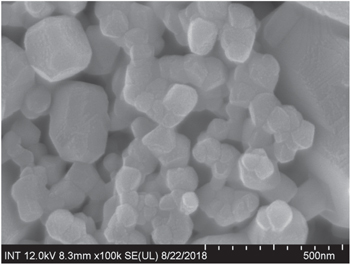
Figure 3. FESEM image of the anode ink.
Download figure:
Standard image High-resolution image3.2. Optimization of the E-jet printing parameters
The novel anode functional layers for electrolyte-supported SOFC were fabricated using E-jet printing technique. The printing parameters such as applied voltage, printing speed, and grid interval were altered to investigate their effect on the structure of the printed layers. Applied voltage is one of the important parameters since it determines the strength of the electric field needed for ink to be jetted. Various applied voltages were investigated for the printing of the anode functional layers. In this case, the pump rate was kept constant at 0.001 ml × min−1. The printing speed and the grid interval were set at 10 mm × s−1 and 0.15 mm, respectively. The applied voltage was varied to investigate its effect on the jetting behavior of the ink. In the range of voltage from 1400 V to 2000 V, the ink deposited in a steady E-jet mode in which the Taylor cone presented continuously and forming a continuous stream of ink from the nozzle to the substrate. At the voltage below 1400 V, the ink jetted in a non-continuous mode because the strength of electric field was not large enough to maintain a stable Taylor cone. At the voltage above 2000 V, complex jetting behavior occurred with tilted jets and multiple jets. Figure 4 shows the optical microscope images of the anode functional layers printed at different applied voltages. In the images, the substrate is bright, the printed lines are the grey lines with the line thickness of around 60 μm.

Figure 4. Optical microscope images of the anode functional layers printed by using different voltages: (a) 1400 V, (b) 1550 V, (c) 1700 V, and (d) 1850 V.
Download figure:
Standard image High-resolution imageAs seen in the figure 4, the line width varies negligibly when increasing the applied voltage from 1400 V to 1850 V. This indicates that the applied voltage in the range for the steady cone-jet mode had an insignificant effect on the deposition speed of ink. In this case, the pump speed was kept the same for different applied voltages that delivered a similar amount of ink to the head of the nozzle. In addition, the printing speed was the same that subsequently led to a similar deposition speed of ink at different applied voltages.
Figure 5 illustrates the optical microscope images of the anode functional layers printed at different printing speeds. In this case, the applied voltage and the pump rate were 1600 V and 0.004 ml × min−1, respectively. As seen in the figure, the printed lines are 2–3 times bigger than those in figure 4. This is due to the higher pump rate used in this case that leads to more ink delivered to the head of the nozzle. The images show that when increasing the printing speed, the printed lines became thinner. Table 1 shows the size of the lines printed at different printing speeds. As seen in the table, when the printing speed increased from 6 to 30 mm × s−1, the average line thickness decreased from 196.6 to 132.1 μm. The layer thickness of the printed lines was measured by breaking the samples and observing the cross sections using an optical microscope. The average layer thickness decreased from 5.0 to 2.8 μm when the printing speed increased from 6 to 30 mm × s−1. In the E-jet printing, at a constant pump rate and applied voltage, the stream of ink jetted from the nozzle is quite stable with an almost constant ink delivery speed. As the printing speed increased, the substrate moved faster during printing. Thus the printed lines received less amount of ink due to the shorter time necessary to get the same printing distance compared to that at lower printing speed.
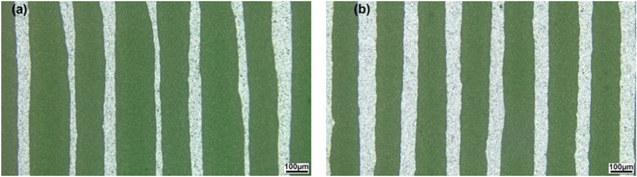
Figure 5. Optical microscope images of the anode functional layers printed at different printing speeds: (a) 18 mm × s−1, (b) 30 mm × s−1.
Download figure:
Standard image High-resolution imageTable 1. The size of the anode lines at different printing speeds.
| Sample | Printing speed (mm × s−1) | Line width (μm) | Layer thickness (μm) |
|---|---|---|---|
| 1 | 6 | 196.6 | 5.0 |
| 2 | 12 | 177.0 | 4.5 |
| 3 | 18 | 158.4 | 3.3 |
| 4 | 24 | 153.1 | 3.1 |
| 5 | 30 | 132.1 | 2.8 |
3.3. Fabrication of anode functional layers by the E-jet and screen printing
After investigating the E-jet printing parameters, the optimal parameters (table 2) were applied to fabricate the multi-layer structured anode functional layers.
Table 2. The optimal E-jet printing parameters of the anode ink.
| E-jet printing parameters | Values |
|---|---|
| Number of grid | 120 |
| Grid length (mm) | 10 |
| Grid interval (mm) | 0.4 |
| Printing speed (mm×s−1) | 10 |
| Applied voltage (V) | 1,800 |
| Distance from surface to the nozzle (μm) | 300 |
| Pump speed (ml×min−1) | 0.001 |
Figure 6(a) shows the optical microscope images of the anode functional layers printed at an applied voltage of 1800 V and a pump rate of 0.001 ml × min−1 with grid interval 0.04 mm. It is obvious to see that the printed lines were almost continuous and quite with the same width, about 0.13 mm. Figure 6(b) shows the optical microscope image of multilayer-structured anode functional layers, the next printed layer being fabricated on the previously printed dried layer (four layers). The functional layers almost covered the surface area of the electrolyte plate completely due to the grid structure of anode functional layers.

Figure 6. Optical microscope images of (a) one layer, and (b) four layers of the anode functional layers printed using E-jet printing.
Download figure:
Standard image High-resolution imageThe FESEM images of the anode functional layer at the surface (figure 7) and the cross section (figure 8) with 1 layer, 4 layers printed by E-jet printing and the layer printed by screen printing. Figures 7(a) and (b) show the FESEM images of single layer anode strips on the electrolyte plate. The thinness of anode caused the discontinuous bands and left some unfilled areas when observed at high magnitude. Figures 7(c) and (d) show the FESEM images of the layers with grid structure and many pores created from the perpendicular printed lines. The grid structure formed an enough thin and foamy membrane to cover a consecutive surface area. Such a structure is expected to have various advantages compared to the continuous layers fabricated using the conventional methods. As seen in the images, the second printed layer was fabricated on the first layer with the printed lines perpendicular to those of the first layer.

Figure 7. FESEM images of the anode functional layer printed by using E-jet printing with (a), (b) one layer; (c), (d) four layers, and (e), (f) by screen printing at different magnitudes.
Download figure:
Standard image High-resolution image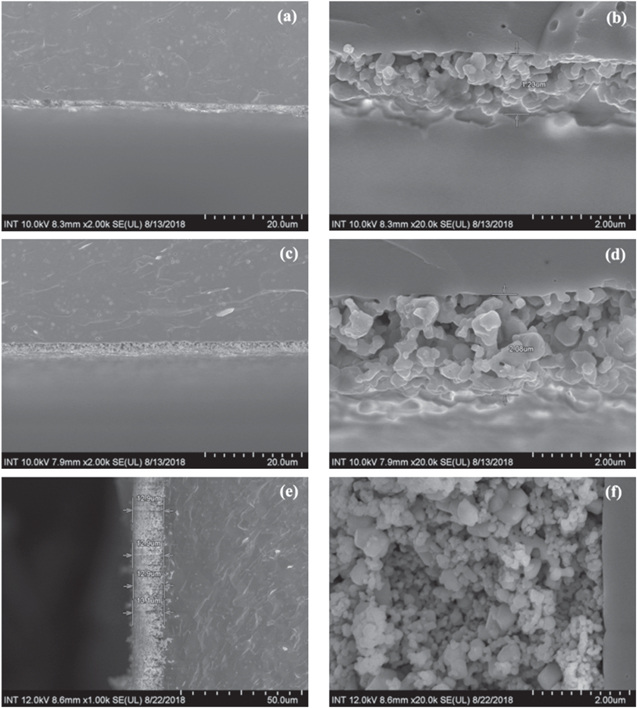
Figure 8. Cross section FESEM images of the anode functional layer printed by using E-jet printing with (a), (b) one layer; (c), (d) four layers, and (e), (f) by screen printing at different magnitudes.
Download figure:
Standard image High-resolution imageSome printed lines of the second layer were fused together which might be due to the rough surface of the substrate after fabricating the first printed layer that made ink at the higher positions flowing to the lower positions and spreading out there. For example, with many pores of the grid structure, the anode functional layer can facilitate the diffusion of fuel gas in and gaseous products out of the layer during the operation of SOFCs. In addition, this grid-structured anode functional layer may have higher active surface area, and greater number of reaction sites for better electrochemical reactions. Thus, the performance of SOFCs could be improved.
Moreover, because the operating temperature of SOFCs is very high, a continuous electrode layer fabricated using the conventional methods commonly faces the problem of cracking and delamination from the electrolyte layer due to thermal expansion mismatch between the electrode material and the electrolyte. This problem makes the electrode not in good contact with the electrolyte layer, thus decreases the performance of the SOFC. A grid-structured electrode layer may be more flexible than a continuous layer, thus can mitigate the cracking and delamination of electrode. With this technique of printing of multiple electrode layers, the thickness of the anode functional layers can be easily adjusted to meet different requirements in the fabrication of SOFCs.
Figure 8 shows the thickness of layers derived from E-jet printing and screen printing. The images indicate that the thickness of E-jet printed layers was roughly 7–10 times less than that of the screen printed one, with 15 μm of thickness (figure 8(f)). Nonetheless, the thickness of E-jet printed samples did not proportionate to the number of layers printed. In the figures 8(b) and (d), the thickness of 4 layers just only doubled the one of single layer. It could be inferred that the viscosity of the anode ink caused the ink flowing down to the slits between ledges of the first printed strips at the second time printing which resulted in no increase in the height of the second layers. Thus, the thickness of 2 layers was as much as the one of single layer. At the third and fourth time, the ink overlaid on the first layer or filled the indented spaces left over the second printing. As a result, the height in total 4 layers folded 2 times the first one. Only about 2 μm of thickness, the 4-time printed one was 7 times thinner than the screen printing but still thick enough to obtain the anode functional layer with the same activities area.
The 3D optical images of the thickness of one anode function layers printed at voltage applied 1800 V and the screen printing layer are shown in figures 9 and 10, with the thickness of anode layers approximately 3 and 18 μm, respectively. There was a significant difference about the thickness measured from FE-SEM and 3D images. The difference might be due the different positions and principle of each measurement.
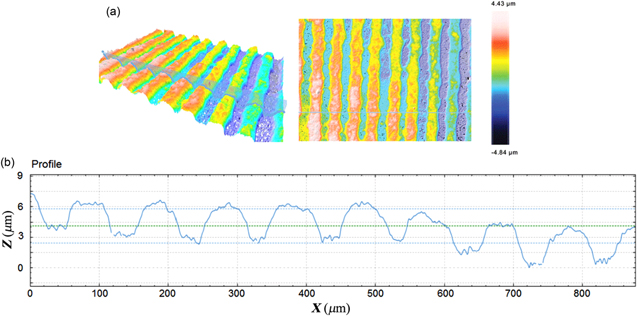
Figure 9. 3D optical microscope images of an anode functional layer printed using E-jet printing.
Download figure:
Standard image High-resolution image
Figure 10. 3D optical microscope images of an anode functional layer printed using screen printing.
Download figure:
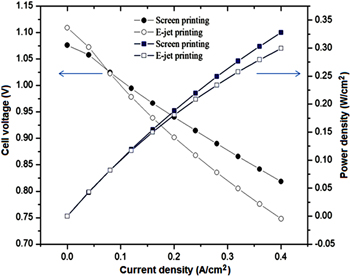
Standard image High-resolution imageThe cell performance tests were executed at operation temperature at 800 °C and the results of I-V and I-P curves are presented in figure 11 with fuelled by H2 and air at the flow rates of 80 and 150 ml × min−1, respectively. Obviously, the OCV values of both cells are approximately 1.1 V, which indicates that no gas leakage occurred through the ScSZ electrolyte layer of the cell and no crack existed on ScSZ film during the performance test. The maximum power densities are 0.33 and 0.30 W cm−2 by using screen printing and E-jet printing, respectively. The difference between the performance of the E-jet printed cell and screening-printing cell is relatively negligible. However, E-jet printing technology benefits from the thickness which is 7–10 times thinner than the screen-printing one, resulting in low cost procedure.
Figure 11. Current voltage characteristics of single cell at 800 °C with one anode functional layer by using E-jet printing and screen printing method.
Download figure:
Standard image High-resolution image
4. Conclusions
We have showed that the E-jet printing technique can be used effectively for the fabrication of the novel grid-structured anode functional layers for electrolyte-supported SOFCs. The structure of the electrode layers could be easily adjusted by altering the printing parameters. The results showed that the size of the printed lines was significantly independent on the change of applied voltage in the range for the steady E-jet mode but affected by changing the printing speed with the decrease of line thickness and layer thickness when the printing speed increased. The grid interval could also be adjusted to obtain the multilayer-structured electrode layers with different printed line density. After investigating the E-jet printing parameters, the optimal parameters with 1,800 V of applied voltage, 0.4 mm grid interval, 10 mm × s−1 of printing speed, 0.001 ml × min−1 of pump speed and 300 μm of distance from surface to the nozzle were applied to fabricate the anode functional layers. The thickness of the anode functional layers could be minimized to roughly 7–10 times less than that of the screen printed one. In addition, the performance of the E-jet printed cell is as high as that of screen printing although the thickness of E-jet printing is 7–10 times thinner than by using the screen printing method.
Acknowledgments
This research is funded by Vietnam National University in Ho Chi Minh City (VNUHCM) under the grand number TX2018-32-01. The authors greatly appreciate the support of SATREPS project and Prof. Shiratori Yusuke for his materials and technical support.
Footnotes
- *
Report presented at 9th International Workshop on Advanced Materials Science and Nanotechnology (IWAMSN2018), 7–11 November 2018, Ninh Binh City, Vietnam