


Abstract
Catalysts NiO/γ-Al2O3 non-promoted and promoted with CeO2, MgO, CaO and Pt have been prepared by the impregnation method and used for hydrogenation of carbon oxides into high caloric synthetic fuel CH4. Physico-chemical properties of catalysts were determined by the methods of Brunauer–Emmett–Teller surface area analysis (BET), x-ray diffraction (XRD), hydrogen temperature programmed reduction (H2-TPR), carbon dioxide temperature programmed desorption (CO2-TPD), transmission electron microscopy (TEM) and scanning electron microscopy (SEM). The activity of catalysts was investigated for CO2 solo-hydrogenation and co-hydrogenation of CO and CO2 mixture at temperature range of 225 °C–400 °C. The particle size of all samples was found to distribute in a range of 15 °C–45 nm and the catalysts' surface area varied from 79 to 95 m2 g−1. Additives increased the thermal stability of catalyst and enhanced the dispersion and reducibility of NiO that led to improve the activity and selectivity of methanation of carbon oxides into CH4. On these catalysts, CO completely converted at 250 °C–275 °C and 80%–90% of CO2 was converted at 400 °C. Addition of CO in feedstock enhanced the efficacy of methanation of CO2-rich gas, increasing CO2 conversion by 3%–25% and rising CH4 selectivity up to 95%–100%.
Export citation and abstract BibTeX RIS
1. Introduction
High consumption of fossil fuels worldwide resulted in rising carbon dioxide (CO2) concentration in the atmosphere, leading to global warming and climate change. One of the most effective ways of dealing with the issue is hydrogenation of CO2 into synthetic fuel CH4 [1]. This reaction was catalyzed by noble and transition metals [2–5] such as rhodium (Rh), ruthenium (Ru), palladium (Pd), iridium (Ir), cobalt (Co), gold (Au), iron (Fe) and nickel (Ni). Among these metals, Ni was seen as the best one, thanks to its high catalytic activity, reasonably manufacturing cost compared to noble metals [5–7] and also being capable at CO2 activation and highly resistant to deactivation. Thus, supported Ni-based catalysts have been widely used for CO2 methanation. Up to now, many attempts have putting on the work of enhancing catalytic activity of Ni such as creating Ni alloy and modifying Ni catalysts by additives.
Metals and promoters were usually supported on γ-Al2O3 and mesostructured silica particles (SBA-15 and MSN). While mesostructured materials are characterized by high specific surface area, γ-Al2O3 is beneficial for CO2 hydrogenation due to its high selectivity toward methane and relatively low cost [8–10]. Overall, NiO/γ-Al2O3 was considered as a potential catalyst for methanation. However, the strong interaction between NiO and γ-Al2O3 tends to create metal aluminate phase and cause it hard to be reduced resulting in its poor activity at low temperatures and its low stability at high temperatures due to high coke formation [11, 12]. To overcome these disadvantages of NiO/γ-Al2O3 catalyst different additives were used.
Alkaline or alkaline earth metal oxides were introduced to weaken the catalyst acidity; precious metals were added to increase the reduction of NiO. For instance, MgO was used to alkalize and increase the thermal stability of catalyst and the NiO dispersion [13], that led to improve the activity and selectivity of CO2 hydrogenation into CH4. CaO was reported to be able to stabilize NiO/γ-Al2O3 catalyst, increase CO2 adsorption [14], prevent the methane cracking to produce coke [15], yielding the enhancement of activity of Ni/γ-Al2O3 catalyst for CO methanation [16]. In addition to increasing the dispersion of NiO, CeO2 is also able to improve the reduction of Ni2+ into high active Ni° for hydrogenation of carbon oxides [17]. Pt was also an additive of interest for NiO catalysts. Pt expressed the ability to form Pt-Ni alloy that increase the dispersion of the active phase and reduce the size of metal particles [18], enhancing H2 adsorption, consequently the catalyst stability was enhanced [19] and the activity of Ni/γ-Al2O3 catalyst in dry reforming of methane was raised [20].
Inul et al [21] demonstrated that CO2 methanation in co-methanation was improved by the CO methanation. A two-stage mechanism of the CO2 hydrogenation reaction was proposed. The first step CO2 was converted to CO via the endothermic reverse water-gas shift reaction [22]. In the second step, these dissociated species was further hydrogenated by hydrogen (H2) to form methane (CH4), known as exothermic CO methanation [23]. As can be seen, CO hydrogenation may supply heat from its reaction to the first step of CO2 methanation. In the result, the methanation reaction can be carried out in a lower range of temperature which is favored for high CH4 selectivity [24]. By this way, addition of CO in feedstock probably accelerates the reaction rate of CO2 hydrogenation. However, there are also suggestions for direct hydrogenation of CO2 into CH4 without the CO generation stage [25]. According to Jiménez et al [26] for hydrogenation of carbon oxides on ruthenium carbon nanofibers catalyst CO was not detected in the product. It has been proposed [22] that over noble metal catalysts supported on metal oxides under conditions of CO2 hydrogenation some amounts of CO2 are converted to CO via the reverse WGS reaction. Thus, effect of CO on the methanation of CO2 still remains mystery to researchers.
For the reasons above and base on our previous studies [16, 27, 28], the purpose of this research is to prepare and test activity of non-promoted and promoted NiO/γ-Al2O3 catalysts with MgO, CeO2, CaO, and Pt in CO2 methanation, and to investigate the promotion effect of CO on this reaction.
2. Experimental
In our previous study on CO methanation [27], the optimal composition of NiO on γ-Al2O3 (Merck) was determined to be 37.7 wt% and the optimal regime for catalyst calcination is 600 °C in 4 h, and reduction at 400 °C in 4 h. Therefore in this study the catalyst 37.7 wt% NiO/γ-Al2O3 was prepared and modified with different additives to further improve its performance. The non-promoted and promoted NiO/γ-Al2O3 catalysts were prepared by the impregnation method as below: firstly, dissolved Ni(NO3)2.6H2O (Prolabo, >99%) and Mg(NO3)2.6H2O (Xilong, >99.0%) or Ce(NO3)3.6H2O (Merck, >98.5%) or [Ca(NO3)2.4H2O (Xilong, >99%) and H2PtCl6. 6H2O (Merck, >99.0%)] in distilled water. Next, the solution was impregnated with γ-Al2O3, and after stirring in 1 hour the obtained suspension was overnight aged and dried at 80 °C, 100 °C and 120 °C for 2 hours for each temperature and calcined at 600 °C for 4 h as described in [28]. The catalysts containing 37.7 wt% of NiO was assigned as NiAl; the promoted catalyst were symbolized as following aMNiAl, representing additive M (MgO, CeO2, CaO, and Pt) content of a wt% loaded onto 37.7 wt% of NiO/γ-Al2O3. Before participating in the reaction, the modified catalyst with MgO was reduced at 450 °C according to [28], the rest one was reduced at 400 °C for 4 hours according to [16, 27].
Characteristics of the obtained catalysts were determined by the methods of BET adsorption (BET NOVA 2200 E), x-ray diffraction (XRD D2-PHASER), TEM (JEM 1400), SEM (FE-SEM S4800). H2-TPR and CO2-TPD diagrams of catalysts were also determined using gas chromatograph (GOW-MAC 69-350), followed the procedure described in the article [29]. The activity of the catalysts was tested in a micro-flow reactor using mixture of H2/CO2/N2 and H2/CO2/CO with a molar ratio of 80/19/1 for CO2 solo-methanation and co-methanation respectively. Methanation of carbon oxides was conducted at atmospheric pressure and temperature range of 225 °C–400 °C, the total flowrate of 3 l h−1 and catalyst weight of 0.2 gram, corresponding to the weight hourly space velocity (WHSV) of 15000 ml h−1 g−1. The reaction temperature was measured using K type thermocouple located in the middle of catalyst layer. The reaction mixture was analyzed by gas chromatography using flame ionization detector (FID) with capillary column DB-624 and thermal conductivity detector (TCD) with capillary column HP-PLOT MoleSieve 5 A.
3. Results and discussion
According to our previous studies, the optimal contents of promoter were 3 wt% MgO [28] and 11 wt% CaO [16]. To further enhance the activity of 11CaNiAl catalyst, Pt as reduction additive was added. To determine the optimal content of additives, NiAl and CaNiAl catalysts modified by CeO2 and Pt are prepared and investigated in the solo-CO2 hydrogenation reaction. The activities of NiAl catalysts modified by CeO2 and Pt + CaO are showed in figures 1 and 2. It can be seen in figure 1, CO2 conversion in solo-methanation over all samples showed upward trends. Although at a temperature lower 325 °C, catalysts NiAl modified by 6% CeO2 don't have the highest CO2 conversion, but in temperatures range from 325 °C to 400 °C, the main temperature regime of CO2 methanation, the highest CO2 conversion belonged to 6CeNiAl sample, its CO2 conversion at 325 °C was 74.0% and increased with increasing temperature and reached at 94.2% at 400 °C, compared to 82.3%, 78.0% and 61.9% of 4CeNiAl, 2CeNiAl and NiAl samples, respectively, at the same condition. The figure 2 shows that CO2 conversion in methanation over 0.1Pt11CaNiAl was always higher than that of others in temperature range of 225 °C–325 °C. In detail, 11CaNiAl sample modified by 0.1 wt% Pt reached 87.6% of CO2 conversion at 325 °C, compared to 79.8%, 77.5%, 79.7% and 53.9% of 11CaNiAl catalysts modified by 0.4, 0.3, 0.2 and 0 wt% Pt, respectively. At a temperature of 350 °C or higher the activity of promoted catalysts is approximately the same (X ∼ 88%–90%) and higher than the non-promoted one. From the results in figures 1 and 2, it followed that both cerium oxide and platinum gave a promoting effect. The optimal content of CeO2 and Pt was found to be 6 wt% and 0.1 wt%, respectively.
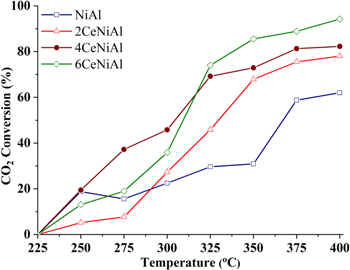
Figure 1. CO2 conversion in CO2 hydrogenation over CeNiAl catalysts varying in CeO2 contents.
Download figure:
Standard image High-resolution image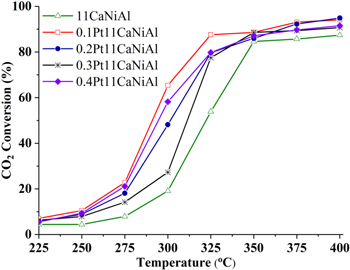
Figure 2. CO2 conversion in CO2 hydrogenation over Pt11CaNiAl catalysts varying in Pt contents.
Download figure:
Standard image High-resolution imageIn the next part, the non-promoted NiO/γ-Al2O3 and the modified catalysts with the optimal composition were used to study the physico-chemical properties and the performance in the hydrogenation of carbon oxides.
3.1. Characterization of the catalysts
XRD spectra of the catalysts (figure 3) showed the characteristic peaks of NiO at 2θ = 37.04°, 43.03°, 62.78°, 75.4°, and 79.4° (JCPDS cards No.71-1179), CeO2 at 2θ = 28.5° (JCPDS cards No.34-394), CaCO3 at 2θ = 29.4° (JCPDS cards No.47-1743), the weak peak of γ-Al2O3 at 2θ = 67.37° (JCPDS cards No.82-1399), and very weak diffraction peaks for MgO [28]. In addition, diffraction peaks for NiO in XRD pattern of 6CeNiAl and 0.1Pt11CaNiAl were considerably less intense than that of NiAl and 3MgNiAl. This result indicated that CeO2 and Pt increased the dispersion of NiO particles on γ-Al2O3. The NiO particle size values of the catalysts, calculated from the Scherrer equation [30], varied from 16 to 28 nm (shown in table 1).

Figure 3. XRD spectra of catalysts: (a) NiAl, (b) 3MgNiAl, (c) 6CeNiAl, and (d) 0.1Pt11CaNiAl.
Download figure:
Standard image High-resolution imageTable 1. BET surface (SBET), average pore diameter (dpore), pore volume (Vpore) of catalysts from BET adsorption isotherm analysis and crystal size of NiO at 2θ = 43.3° (dNiO), and maximal reduction temperature (Tmax) from H2-TPR diagrams.
| Catalyst | SBET (m2 g−1) | Vpore (cm3 g−1) | dpore (nm) | dNiO (nm) | Tmax (°C) |
|---|---|---|---|---|---|
| NiAl | 89.4a | 0.098a | 4.88 | 23.42 | 380 |
| 3MgNiAl | 79.2a | 0.123a | 6.08 | 22.66 | 415 |
| 6CeNiAl | 95.0 | 0.065 | 4.04 | 20.90 | 396 |
| 0.1Pt11CaNiAl | 83.0 | 0.062 | 4.48 | 15.89 | 351 |
aThe specific surface area of Al2O3 (SBET): 225 m2 g−1 [28].
According to data in table 1, loading NiO and promoters accounted for falling of specific surface area from 225 m2.g−1 of γ-Al2O3 to 80–95 m2.g−1 due to a low specific surface area of them and covering the carrier pore by NiO and promoter particles.
SEM images of NiAl, 3MgNiAl, and 6CeNiAl catalysts (figures 4(a)–(c)) showed uniform particles and almost sphere shape (tens nm in size), ascribed to NiO and big blocks (hundreds of nm in size), which was attributed to carrier. The big blocks on non-promoted sample had larger size than that on promoted one, indicating that the additives improved the thermal stability of the catalyst.

Figure 4. SEM images of catalysts: (a) NiAl, (b) 3MgNiAl, (c) 6CeNiAl, and (d) 0.1Pt11CaNiAl.
Download figure:
Standard image High-resolution imageThere were significant differences in the shape of NiO particles on NiAl, 3MgNiAl, and 6CeNiAl samples compared to 0.1Pt11CaNiAl one (figure 4(d)). The NiO particles on the first three samples had a smooth, rounded shape, while on the fourth one the fine, spongy and sharp edges particles were presented. This showed that the first three catalysts were sintered to a certain degree when were heated at 600 °C while the last one was not. From this observation it can be concluded that CaO exhibited higher ability to increase the thermal stability of the NiAl catalyst than other additives.
It can be derived from the TEM analysis (figure 5) that nanoscale NiO particles have been successfully prepared although the NiO content in catalysts is as high as 37.7 wt% thanks to the high specific surface area (225 m2 g−1) and large pore diameter (>4 nm) of γ-Al2O3. The NiO particles of several nm inside the pore (bright colored spots) and particles of dimensions from several nm to several tens' nm on the outer surface of γ-Al2O3 (dark spots) can be observed. Two samples modified with MgO and CeO2 showed smaller and discrete particles than others. On the 3MgNiAl sample besides very small dark-colored particles, 50–80 nm blocks covering the surface of the carrier were also observed. Therefore this sample showed the smallest specific surface area (table 1). Compared to MgO promoted sample, 6CeNiAl and especially 0.1Pt11CaNiAl catalysts showed higher densities of dark spots on the surface. This is explained by the fact that in these two samples CeO2 and CaCO3 crystals coexist with NiO crystalline particles while MgO exists in the amorphous state (from the XRD analysis). The additional surface covering of CaCO3, as evidenced from the XRD spectra and CO2-TPD profiles (figure 7), also contributed to a slight reduction in the surface area of the PtCaNiAl catalyst compared to non-promoted one (table 1). The CeO2-modified catalyst is the most evenly distributed and uniform NiO particles compared to the others, resulting in the highest surface area of this sample. In particular, specific surface area of 6CeNiAl catalyst (95.0 m2 g−1) is greater than that of the non-promoted catalyst NiAl, which may be explained that CeO2 enhanced the dispersion of NiO on surface and into pore of the support, it also prevents NiO particles from sintering.

Figure 5. TEM images of catalysts: (a) NiAl, (b) 3MgNiAl, (c) 6CeNiAl, and (d) 0.1Pt11CaNiAl.
Download figure:
Standard image High-resolution imageH2-TPR diagram of the NiAl catalyst (figure 6) indicated a single reduction peak (α2) at 380 °C, attributed to the reduction of NiO species weakly interacted with support. The strong interaction of NiO with the MgO additive was demonstrated by shifting the reduction peak α2 to α3 with the higher temperature (415 °C) and the lower reduction intensity on H2-TPR diagram of 3MgNiAl catalyst. In contrast, 6CeNiAl and 0.1Pt11CaNiAl profiles displayed similar outcomes, there were four reduction peaks between α1 and α3 (327 °C–415 °C). According to Liu et al [31] the peak appeared in the range of 360 °C–640 °C on H2-TPR diagrams of the CeO2-promoted NiO/γ-Al2O3 catalysts is corresponding to the reduction of NiO species. It was reported by Zhou et al [32] that for NiO/CeO2 sample a peak at temperature range of 280 °C–330 °C characterized the reduction for NiO species on the subsurface of the NiO/CeO2, while a peak at 380 °C can be attributed to the reduction of bulk NiO species. Thus, it can be assumed that the reduction peaks at 373, 390 and 396 °C on the 6CeNiAl sample were attributed to the reduction of the NiO small particles interacting with CeO2, NiO with γ-Al2O3 and NiO blocks interacting with CeO2, respectively.

Figure 6. H2-TPR diagrams of catalysts.
Download figure:
Standard image High-resolution imageCompared to NiAl, the maximum reduction temperature of buck NiO (α4) in the 11CaNiAl sample was higher (around 550 °C versus 380 °C) [16], meaning that CaO made interaction NiO-Al2O3 becomes stronger and NiO harder to be reduced. On the TPR diagram of 0.1Pt11CaNiAl sample the reduction peak α4 appeared very weak instead of it there were three reduction peaks appearing in the lower temperature region. According to [33], for high dispersed platinum state, the hydrogen reduction took place in the temperature range of 250 °C–400 °C. In our previous work [34], the reduction peaks in the TPR diagram of Pt/γ-Al2O3 catalysts at 230 °C–250 °C and 420 °C–430 °C, characteristic for the reduction of Pt4+ → Pt2+ and Pt2+ → Pt° were proposed. Subramanian [35] demonstrated that, in the system Pt/γ-Al2O3 the reduction process took place in the temperature range of 300 °C–500 °C. Therefore, it can be suggested that two first peaks on TPR diagram of PtCaNiAl sample at 310 °C and 330 °C between α1 and α2 characterized the reduction of the highly dispersed Pt4+ in Pt2+ and Pt2+ in Pt° overlapped with the reductions of dispersed NiO particles (α1) and NiO species weakly interacted with support (α2), while the third peak (351 °C), with the most intense, ascribed to the reduction of NiO species. The reduction peaks of 0.1Pt11CaNiAl sample appeared at lower temperatures with stronger intensity than others one, indicating that this catalyst had the best reduction properties, promising high activity. Sample 6CeNiAl took second place after 0.1Pt11CaNiAl in terms of the amount of reduced NiO.
From the TPR results, it can be seen that the CeO2 and Pt additives increased the reducibility of NiO, while alkali metal oxides CaO and MgO reduced this quantity. The results revealed that NiO in 3MgNiAl catalyst can be effectively reduced to Ni° in a hydrogen atmosphere at temperatures of 450 °C and the rest catalysts did it at 400 °C. So, the reduction conditions of catalysts before testing their activity displayed in the experimental were consisted.
It can be seen in figure 7, NiAl, 3MgNiAl and 6CeNiAl catalysts showed similar CO2-TPD diagrams. In detail, there were several CO2 desorption peaks appearing in a temperature range of 70 °C–250 °C, in which the highest intense peaks are recorded from 110 to 200 °C. The desorption peak was attributed to the weak basic sites [36]. According to BET specific surface area, 3MgNiAl sample had the lowest one; however, the amount of CO2 desorption of this sample was slightly higher than that of two others. This is because the presence of MgO increased Lewis basicity leading to improve CO2 chemisorption. As for 0.1Pt11CaNiAl, there was a complex CO2-TPD diagram including four considerable CO2 desorption peaks in a wide range of temperature. In detail, two CO2 desorption peaks centered at 118 °C and 143 °C attributed to weak Lewis-basic sites and a large peak documented at 345 °C can be assigned to the medium strength basic sites [36]. It is noticed that there is a giant CO2 desorption peak at 550 °C on CO2-TPD diagram of the 0.1Pt11CaNiAl catalyst, which can be attributed to the formation of  or
or  leading to a strong interaction between CO2 and the support as mentioned in [37]. So, promoting by the high CaO loading content (11 wt%) caused enhancement of basicity and adsorption of CO2 of NiAl catalyst.
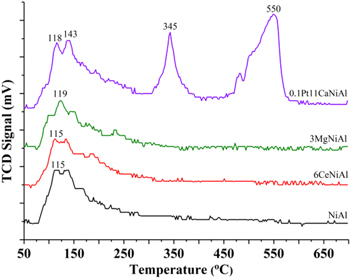
Figure 7. CO2-TPD diagrams of catalysts.
Download figure:
Standard image High-resolution image3.2. Activity of the catalysts
It was clear from figure 8 that all promoters greatly enhanced the activity of catalyst in hydrogenation of CO2. On the modified catalysts, the reactions began to take place at temperatures of 225 °C–250 °C, in contrast, at temperatures under 300 °C, both reactions on non-promoted NiAl did not happen.
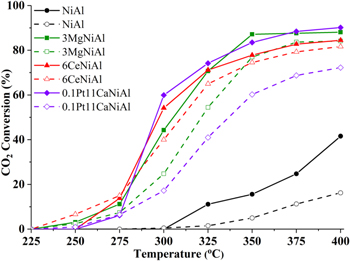
Figure 8. CO2 conversion in co-hydrogenation of the mixture of CO2 and CO (solid lines) and of solo CO2 (dashed lines) over the catalysts.
Download figure:
Standard image High-resolution imageIt has been shown in figure 8, CO2 conversion in the co-hydrogenation of carbon oxides mixture (case I) was much higher than those in CO2 solo-hydrogenation (case II). In term of the NiAl catalyst, the gap between CO2 conversions of two cases of hydrogenation increased markedly corresponding to the rise of temperature in a range of 300 °C–400 °C. The 3MgNiAl catalyst produced a substantial CO2 conversion. As for CO2 methanation in co-hydrogenation, the started reaction temperature is 250 °C which is lower than 300 °C of the NiAl catalyst. This is because MgO prefers a high CO2 adsorption capacity. Consequently, CO2 conversion at 400 °C for both cases of CO2 methanation on the 3MgNiAl catalyst was somewhat satisfied, the former finished at 88.1% of CO2 conversion, the latter ended at nearly 4% lower. Observably, CO2 conversion graph of the co-hydrogenation reaction was always above that of the CO2 solo-hydrogenation.
Paradoxically, at 250 °C, while the hydrogenation reaction on the 6CeNiAl catalyst in the second case occurred, the first case did not happen. This phenomenon may be due to the adsorption competition between CO and CO2 on the catalyst. In a higher temperature range of 275 °C–400 °C, CO2 conversion in the first case was always greater than that in the second case because at that temperature region CO has completely converted, as seen in figure 9. In general, comparing the conversion of CO2 (figure 8) and CO (figure 9) in co-hydrogenation showed that CO2 started to be converted at the temperature, where CO was almost completely consumed, it is 250 °C for MgNiAl, 275 °C for CeNiAl and PtCaNiAl and finally 325 °C for NiAl catalyst. According to Inui et al [21] this phenomenon indicated that the adsorption of CO on catalysts in the reaction condition is much stronger than that of CO2 that inhibit the CO2 methanation. However, it should be noted that, even in the absence of CO of CO2 solo-hydrogenation case, the conversion of CO2 is lower than that in the co-hydrogenation reaction. Thus, CO adsorption may inhibit the CO2 hydrogenation in the low temperature region, while in the high temperature zone the difference in the conversion of CO and CO2 is mainly related to the nature of the reactants.
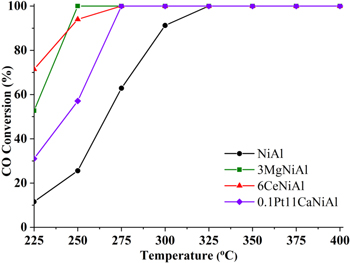
Figure 9. CO conversion in co-hydrogenation of CO + CO2 mixture on the catalysts.
Download figure:
Standard image High-resolution imageIn the reaction product mixture, besides the main product CH4, the by-product is only CO, other hydrocarbons are not detected. Figures 8 and 10 show that, in the CO2 solo-hydrogenation reaction, the CH4 selectivity is low at low CO2 conversion, increases with increasing CO2 conversion except catalyst modified by MgO. The existence of CO as a by-product of the CO2 solo-hydrogenation reaction is an evidence of occurrence of water-gas shift reaction in condition of CO2 hydrogenation reaction [22]. CO, which is more easily hydrogenated as showed in figure 9, in a mixture with CO2, hydrogenated at a lower temperature and the generated heat in this reaction providing to the endothermic stage converting CO2 into CO that promoted the main reaction of CO2 hydrogenation.
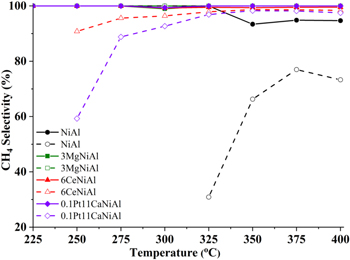
Figure 10. CH4 selectivity in co-hydrogenation of the mixture of CO2 and CO (solid lines) and of solo CO2 (dashed lines) over the catalysts.
Download figure:
Standard image High-resolution image
On MgNiAl catalyst in CO2 solo-hydrogenation CH4 selectivity reached 100% even when CO2 conversion was very low (2.5% at 250 °C), means no CO was found in the reaction product mixture. This may be related to the fact that this catalyst possesses the highest activity in CO hydrogenation, which completely converts CO to methane at temperatures as low as 250 °C, as shown in figure 9. It was reported [22] that the occurrence of WGS reaction in carbon oxides hydrogenation depends on the nature of the active metal and carrier.
The promotion effect of CO in CO2 hydrogenation is expressed most impressively on 0.1Pt11CaNiAl catalyst thanks to it being modified simultaneously by both Pt and Ca additives. The former has a strong affinity to H2, and the latter raises the support's basicity causing the high CO2 adsorption. At 275 °C, CO2 conversion of both cases of hydrogenation was analogous, at around 6.3%. At the next temperature level (300 °C), although CO2 conversion in the CO2 solo-hydrogenation was three-fold, that in the co-hydrogenation was approximately 10 times as large as its CO2 conversion at 275 °C. Finally, at 400 °C, the first finished at 72.3% of CO2 conversion and the second ended at 90.2%. Apparently, CO2 conversion rapidly increases under the addition of CO into reactants.
Comparing the results in figures 8 and 9 indicated that the activity of catalysts in hydrogenation of CO was much higher than that of CO2. Even at 225 °C the CO conversion on catalysts has reached a value of several tens of percent while CO2 hydrogenation has begun at 275 °C. Similar to hydrogenation of CO2, the improvement in activity of NiAl catalysts by adding of promoters was also impressively expressed in hydrogenation of CO. In detail, at 250 °C CO conversions in hydrogenation of carbon oxides mixture over 3MgNiAl, 6CeNiAl and 0.1Pt11CaNiAl catalysts reached 100%, 94.0% and 57.1% respectively compared to 25.6% on non-promoted catalyst NiAl. The temperature of 100% CO conversion were 250 °C and 275 °C respectively for 3MgNiAl and 6CeNiAl, 0.1Pt11CaNiAl catalysts, compared to 325 °C for the non-modified catalyst.
In general, the order in the activities of catalysts, evaluated in CO2 conversion in CO2 solo-hydrogenation (case II) and CO conversion in co-hydrogenation of mixture of CO and CO2 (case I), was observed as follows: 3MgNiAl ≈ 6CeNiAl > 0.1Pt11CaNiAl ≫ NiAl. It indicated that hydrogenation of carbon oxides takes place on the one kind of active center. The results obtained in the study confirm that the presence of CO in feedstock activated the CO2 hydrogenation and in this case the order in the activities of the promoted catalysts was 0.1Pt11CaNiAl ≈ 3MgNiAl > 6CeNiAl ≫ NiAl. However, the mechanism of CO promotion for CO2 methanation is still not clear because the mechanism and intermediate compounds of CO2 hydrogenation although have been discussed extensively in the references but there is still no agreement. There are two perspectives on the mechanism of hydrogenation of CO2 into methane, namely the direct conversion of CO2 to CH4 without the formation of CO and the second mechanism is indirect methanation, through CO formation [38].
In terms of surface compounds, some argue that CO is intermediary of CO2 methanation and others reported that CO was not a key intermediary. Some studies confirm that CO2 directly dissociated into CO, which is the main intermediate of the reaction. For example, adsorbed CO2 dissociated to adsorbed CO and O on the surface of the catalyst Ni/γ-Al2O3, which continues to hydrogenate into CH4 [39, 40]. On Ru/TiO2 it was proposed that, through the reverse water gas shift reaction H2 facilitates the dissociation of CO2 to adsorbed CO, and formation adsorbed CO is the rate determining step of methanation [41]. Other studies suggest that CO is formed from already formed species, resulting from the reaction of adsorbed CO2 with H2 dissociated on metal sites [42]. For example, this was proposed for Ru catalysts [43, 44], CeO2-contained [45, 46] and Ni/MgAl-MMO [47] catalysts.
It seems that the intermediate compound depends on the activity phase and catalyst carrier. However, it was shown that the energy barrier for CO2 hydrogenation to formate followed by decomposition to CO is similar to that of direct dissociation of CO2 to CO on Ru nanoclusters supported on TiO2 [48]. It is likely that the reaction mechanism is highly dependent on the nature of the active metal and support of the catalyst. From the results presented above, on studied catalyst the reaction takes place under the second mechanism, through the creation of intermediate compounds CO.
In methanation three main reactions take place in the process: mildly endothermic reverse water gas shift, highly exothermic methanation of CO and CO2. It can be argued that the promotion of CO addition in CO2 methanation thanks to its prior hydrogenation provides heat for endothermic reverse water gas shift, facilitating CO formation and making the reaction to achieve the same CO2 conversion extent at a lower reaction temperature than the solo CO2-hydrogenation reaction and the consumption of generated heat of hydrogenation reaction keep the methanation of CO2 within an ideal temperature range at the optimum value, balancing between the thermodynamic and kinetic properties of the reaction.
Generally, CH4 selectivity in the co-methanation was higher and more stable than that in the CO2 solo-methanation (figure 10). Indeed, CH4 selectivity of the CO2 solo-methanation on NiAl catalyst at 325 °C was approximately 31% and gradually rose to 73 °C–77% when the reaction temperature was increased to 400 °C. In co-hydrogenation, on this catalyst there was a dramatic improvement in CH4 selectivity, it was ranged from 93% to 95% in the reaction temperature range of 350 °C–400 °C. There were incredible tendencies for CH4 selectivity of CO2 methanation over 3MgNiAl, it almost remained stable at 100% in both cases as depicted in figure 10 thanks to its very high activity in CO hydrogenation as seen in figure 9. As seen, over the 6CeNiAl and 0.1Pt11CaNiAl catalysts CH4 selectivity in CO2 solo-hydrogenation gradually increased respectively from 70% and 60% at 250 °C to approximately 97% at 350 °C or higher, while in co-hydrogenation this quantity was always higher than 99% at all temperatures.
4. Conclusion
In the study nanostructured promoted NiO catalysts on highly porous alumina were successfully prepared by the impregnation method. Alkaline and precious metal additives dramatically changed physico-chemical properties of NiO/γ-Al2O3 catalyst that increased the catalytic activity and CH4 selectivity of hydrogenation of CO2-rich gas. Owning high activity for methanation of carbon oxides promoted NiO/γ-Al2O3 catalysts completely converted CO at temperatures as low as 250 °C–275 °C and converted 80 °C–90% CO2 at 400 °C. CO promoted CO2 hydrogenation, its presence increased CO2 conversion by 3–25% and raised CH4 selectivity up to 95%–100%.
Additives improved the dispersion of nanoscale NiO particles and protected them from sintering. MgO and CaO enhanced the support's basicity and CO2 adsorption while CeO2 and Pt improved the reduction of Ni2+ to active phase. MgO was the best promoter for hydrogenation of CO and solo CO2. However, the catalyst simultaneously modified by additives of the two group (Pt and CaO) boosted methanation of carbon oxides mixture due to the strong hydrogen affinity of Pt and the high CO2 adsorption of CaO.
The combination of introducing additives into NiAl catalysts and adding CO to the feedstock was a potential measure to increase the conversion of CO2-rich gas into valuable products like CH4 and reduce emissions of greenhouse gas.
Acknowledgments
This research was supported by Vietnam Academy of Science and Technology under the Grant No. ĐLTE00.10/18-19.