


Abstract
This work focused on employing Calotropis gigantea leaf extract as reducing agent/fuel and (Zn(NO3)2.6H2O), (Cu(NO3)2.3H2O) as precursors to synthesise ZnO–CuO nanocomposite by solution combustion method. Prepared nanocomposites were characterised using x-ray powder diffraction (XRD), scanning electron microscope (SEM) with energy dispersive x-ray analysis (EDAX), high-resolution transmission electron microscopy (HR-TEM) and Fourier transform infrared spectroscopy (FT-IR). XRD result revealed crystalline nature with average crystallite size of 35 nm. SEM images indicate that particles are agglomerated and EDAX confirms the composition of elements with pure phase. HR-TEM images indicated that average sizes of the prepared ZnO–CuO nanocomposite were 10–40 nm with spherical and hexagonal shapes. The presence of functional groups such as Zn−O, Cu−O, −OH, −C–O, and C–H was confirmed by FT-IR spectrum. The optical energy bandgap was estimated using Kubelka-Munk equation by the aid of diffuse reflectance spectroscopy (DRS). The synthesised nanocomposite showed superior photocatalytic activity of degradation efficiency 97.93% against methylene blue dye. Further, anti-bacterial activity was investigated by agar well diffusion procedure against two bacterial strains (Escherichia coli and Staphylococcus aureus) and significant zone of inhibition to the bacterial strains was observed.
Export citation and abstract BibTeX RIS
1. Introduction
Nanoparticles have attracted a lot of attention due to their interesting physical/chemical properties compared to bulk [1]. Specifically, metal oxide nanoparticles (MO NPs) have caught people interest because of their unique optoelectronic, catalytic properties and specific probing action in biological and chemical processes [2]. Further, the classes of mixed MO NPs have already established an increasing research focus due to their promising applications in science and technology. The incorporation of metals to an oxide matrix can result in potential materials having chemical/physical properties leading to enhanced performance in various applications. In oxide matrix system having composite materials with matching band potentials, the metal could behave as isolated entity or possess modified property due to interactions between metal and oxygen [3], which considerably improves the performance of a material, charge separation efficiency, enhances charge transfer and life time of carrier at nanostructured scale [4]. It is imperative to know that most of single-phase combined oxides exhibit properties of constituent oxides [5]. Multiphase nanocomposite materials have been used for various applications viz., antibacterial activity, photocatalysis, electrochemical sensors, etc [6–9]. Many research groups have synthesised MO NPs such as CeO2–MnOx [10], CuO–ZnO [11], ZnO–NiO [12], ZnO–MgO [13], TiO2–WO3 [14], Co3O4–ZnO [15], using various methods. However, solution combustion method has attracted great deal of attention compared to other methods due to its simplicity, single-step, instantaneous and energy saving features. These studies [10–15] have reported high photo-carrier segregation efficiency compared to that of oxides. Owing to high carrier separation efficiency of these MO NPs, good deal of work has focused on the oxides with multiphase [16]. However, double heterojunctions between the phases have been studied earlier.
Among metal oxides, zinc oxide (ZnO), an intriguing n-type, direct bandgap semiconductor, has drawn attention owing to its appealing properties of green characteristics, excellent stability, single-step synthesis route and low price [17–19]. ZnO is given much attention for biological activity. J Sawai et al reported on the biological activity and applicability of ZnO, MgO and CaO NPs for quantitative assessment against Escherichia coli and Staphylococcus aureus [20]. ZnO NPs inhibit the bacterial growth by damaging cell membrane and damaged wall shows strong antibacterial activity on spectrum of bacteria [21]. Various research groups [22–27] have reported on ZnO NPs nano-toxicity and their interaction with bacterial cells. On the other hand, copper oxide (CuO), a p-type, small bandgap semiconductor has been widely utilised for various purposes due to its unique eco-friendly features, excellent chemical stability, anti-inflammatory and anti-bacterial activities [28–30]. CuO has become one of the most attractive materials and has been extensively applied in gas sensing, photo-electrochemical water reduction, super-hydrophobic surfaces, photodegradation reactions, photovoltaic applications, solar hydrogen production and catalytic activities [31, 32].
Various natural and synthetic dyes are commonly utilised in leather, textile, food and plastic industries. Dye dissolved water has become major effluent coming out from industries which pollutes water and hence, raised a serious hazard to marine life and subsequently bionetwork. Therefore, it is imperative to reduce the major effluent dyes before the toxic water enters rivers/oceans. Among various dyes, methylene blue (MB) has been considered as the most commonly used dye in the textile industries, which has to be degraded prior to polluting the water. Hierarchical MO NPs like CuO–ZnO can be applied as a very operative photocatalyst to MB dye degradation. In addition, these MO NPs have been employed in varied applications including solar cells, field effect transistors (FET), sensing and photocatalysis [33–37] due to their key features like high adsorption ability, additional sites for functional moieties, high porosity, etc MN OPs are also utilised for biocides and disinfectants.
Green synthesis has become one of the promising techniques, which prevails the limitations/constraints of chemical methods. This technique includes the application of some fungus, microorganisms and plants during synthesis [38]. Calotropis belongs to Asclepiadaceae family and is also known as Akada, Aak, Mandar, Aakh, etc. It has two species procera and gigantea. In the present work, Calotropis gigantea has been taken for the green synthesis of ZnO–CuO nanocomposite. From previous studies, it is clear that the plant is rich source of alkaloids, glycoside, tannins, phenolic compounds, flavonoids, terpenoids, etc, which can act as stabilising agent and reducing agent [39]. Additionally, the employed plant is cost effective and easily available, to the best of our knowledge the Calotropis gigantea leaf extract has not been used to synthesise ZnO–CuO nanocomposite through solution combustion method. Hence, in this study we have used Calotropis gigantea leaf extract for synthesis of ZnO–CuO nanocomposite. Prepared nanocomposite were characterised using XRD, SEM with EDAX, HR-TEM and FT-IR. The optical energy bandgap was determined using DRS. The synthesised nanocomposite showed superior photocatalytic activity against methylene blue dye. Further, anti-bacterial activity was investigated by agar well diffusion procedure against two bacterial strains namely Escherichia coli and Staphylococcus aureus.
2. Experimental section
2.1. Materials
The plant leaves of Calotropis gigantea were collected from different regions of Davangere. The collected leaves were washed using tap water and distilled water, then shade dried and powdered. The powder was further used for NPs synthesis.
The chemicals (analytical grade) zinc nitrate hexahydrate (Zn(NO3)2.6H2O) and copper nitrate trihydrate (Cu(NO3)2.3H2O) were bought from SD-Fine Chemicals Pvt. Ltd and Hi-media and were used without any additional purification.
2.2. Instrumentation and experimental methods
With the assistance of an x-ray diffractometer (Rigaku Smart Lab x-ray diffractometer) crystallinity and phase purity were studied. SEM and EDAX (Hitachi S3400n) were used to examine the morphology and elemental composition of the obtained material. The spectrum was recorded (350–4000 cm−1) with the help of FT-IR spectrometer (Bruker alpha-P) to study the functional groups. The morphology of the NPs was valued using HR-TEM (Jeol/JEM 2100). With water as a reference, absorption spectra were recorded with UV–Visible spectrophotometer (Agilent Technologies Cary-60 spectrophotometer). Visible annular photoreactor was procured from 'HEBER' Scientific, Chennai, India.
2.3. Synthesis of ZnO–CuO nanocomposite
Freshly gathered leaves of Calotropis gigantea were washed, dried and ground well. With water as a solvent, Soxhlet extractor was used for the extraction and then the obtained sample was arid using a rotary evaporator. To synthesise ZnO–CuO nanocomposite, combustion synthesis was employed using Zn(NO3)2.6H2O and Cu(NO3)2.3H2O as oxidisers and extract of Calotropis gigantea leaves as fuel. In the current proceeding, 2 mg of the extract was dissolved in 100 ml of double distilled water and was constantly stirred around 10 min to become a homogenous solution. Stoichiometric ratio of 1:1 Zn(NO3)2.6H2O and Cu(NO3)2.3H2O was dissolved in 10 ml of Calotropis gigantea extract and placed in a preheated muffle furnace (400 °C ± 10 °C). With the smoldering reaction taking place, the entire process was completed within a span of 10 min Obtained ZnO–CuO nanocomposite was subjected to calcination at 500 °C for 3 h to eliminate the impurities. Until further use, the obtained product was stored in an airtight container.
In table 1, various synthesis methods and our employed combustion method have been compared with a view to clarify the novelty. It is noticed that Calotropis gigantea leaf extract has been used for the first time in the employed method. In addition, solution combustion method is a single step, less time consuming and cost-effective method with minimum impurities.
Table 1. Comparison result related to synthesis of ZnO–CuO nanocomposite.
| Material | Precursor | Synthesis methods | Stabilising & capping agents | Particle size/references |
|---|---|---|---|---|
| ZnO −CuO nanocomposite | ZnCl2CuSO4 | Co-precipitation | Oxalic acid | 20 nm 40] |
| Zn(CH3COO)2 | ||||
| Cu(CO2 CH3)2 | Spray pyrolysis | Perfume | 25–45 nm 41] | |
| ZnO NPs CuCl2 | Green synthesis | Melissa officinalis | 10–20 nm 42] | |
| Zn(NO3)2 Cu(NO3)2 | Green synthesis | Theobroma cacao seed bark | 20–50 nm 43] | |
| (Zn(NO3)2.6H2O) (Cu(NO3)2.3H2O) | Green synthesis (Solution combustion) | Calotropis gigantea leaf extract | 10–40 nm present work) |
2.4. Photo catalytic studies
By the degradation of cationic methylene blue (MB) dye in aqueous media with a light source as a 250 W UV light irradiator, the photocatalytic studies of the synthesised ZnO–CuO nanocomposite were done. The usage of a visible annular photoreactor was done for photocatalytic experiments, which consists of cylindrical tubes with a transparent interior to employ complete radiation. In this process, 50 mg of ZnO–CuO nanocomposite as a photocatalyst was supplemented to quartz tubes of 100 ml capacity (37 cm length, 2.3 cm inner diameter and 2.7 cm outer diameter) consisting of 100 ml MB solution of concentration 5 ppm (parts per million). 6 cm is the distance maintained between lamp and the quartz (throughout the experiment). The solution was continuously air bubbled for the complete union of the MB dye and photocatalyst (ZnO–CuO), then 2 ml of the solution was taken out from the above solution, at the regular time intervals of 15 min Degradation percentage of the cationic MB dye has been calculated using Beer–Lambert law as follows [44, 45]

where, Ci and Cf are the initial and final concentrations of dye solution, respectively.
2.5. Antibacterial studies
ZnO–CuO nanocomposite was screened against Gram + ve bacteria NCIM-5022 and Gram-ve bacteria NCIM-5051 through agar well diffusion method for antibacterial activity [20]. Nutrient agar (NA) media were used for the antibacterial study. The NA plates were prepared using 28 mg of NA media (composition of NA: Peptic digest of animal tissue 5 mg; yeast extract 1.5 mg; beef extract 1.5 mg; agar 15 mg; sodium chloride 5 mg; pH adjust sterilisation at 7.4 ± 0.2). Then, it was dissolved in 1000 ml of double distilled water and subjected for pasteurising at 121 °C with pressure of 15 lbs for 15–20 min Staphylococcus aureus (NCIM-5052) and Escherichia coli (NCIM-5051) bacterial strains were subcultured in nutrient broth at 37 °C for 24 h. NA plates with 100 μl of 24 h mature broth culture of each bacterial strain were prepared and swabbed using a sterile L-shaped glass rod. In each Petri plate 6 mm wells were made using the sterile cork borer. The ZnO–CuO nanocomposite was dispersed in sterile double distilled water and loaded onto the well (500 and 1000 μg ml−1). As a positive control, ciprofloxacin was used as a standard antibiotic. Based on earlier reports, concentration was standardised and selected. The zone of inhibition (ZOI) was measured after the incubation of NA plates for 24 h at 37 °C. The whole process was carried out in triplicate with ZnO–CuO nanocomposite and the average values of ZOI were measured for determination of the antibacterial activity [46, 47].
3. Results and discussion
3.1. X-ray diffraction analysis
The diffractogram of green synthesised ZnO–CuO nanocomposite is depicted in figure 1. The XRD peaks are well-matched with the standard value of JCPDS (No. 3–888 and 5–661). From XRD pattern, it is confirmed that ZnO–CuO nanocomposite showed a well crystalline nature with no impurity peaks. Further, there is no secondary phase observed which confirms the pure phase. The crystallite size of ZnO–CuO nanocomposite was assessed using Debye–Scherrer's formula [45].

where, 'D': crystallite size of synthesised NPs, 'λ': wavelength of x-ray radiation (1.54 Å), 'β': full width half maximum (FWHM) of diffraction peak and 'θ': Bragg's diffraction angle. The average crystallite size of ZnO–CuO nanocomposite was found to be 35 nm.
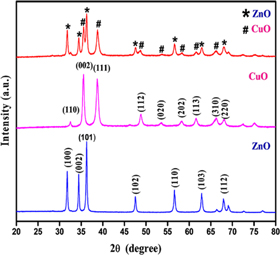
Figure 1. XRD pattern of ZnO–CuO nanocomposite.
Download figure:
Standard image High-resolution image3.2. Morphological analysis
The structural analytical techniques were employed for morphological and element content evidence of biosynthesised ZnO–CuO nanocomposite. Figures 2(a), (b) shows the SEM micrographs, in which particles were agglomerated with irregular shape. During the synthesis high energy leads to the agglomeration of nanocomposite.
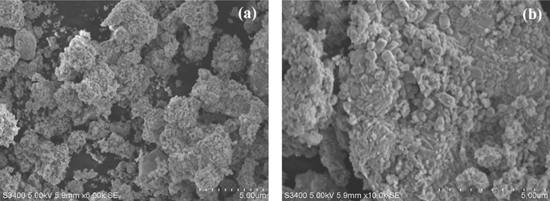
Figure 2. SEM images of ZnO–CuO nanocomposite with different magnifications.
Download figure:
Standard image High-resolution imageThe elemental composition of synthesised nanocomposite ZnO–CuO was studied with the aid of the EDAX analysis which confirms the presence of elements Zn, Cu and O with no impurity in ZnO–CuO nanocomposite (figure 3). TEM micrograph (figures 4(a), (b) shows particles are in spherical and hexagonal shapes. Figure 4(c), (d) depicts the HR-TEM micrographs. Specifically, in figure 4(d), different sized particles are clearly noticeable and their average sizes were found to be 10–40 nm.
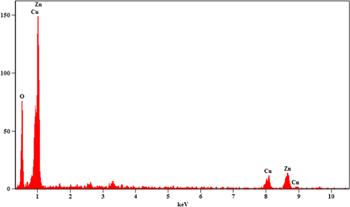
Figure 3. EDAX spectrum of ZnO–CuO nanocomposite.
Download figure:
Standard image High-resolution image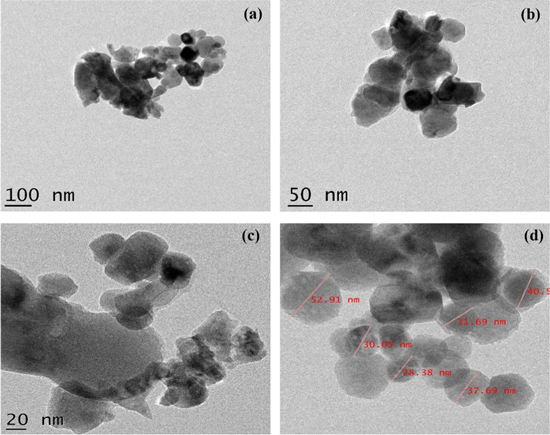
Figure 4. (a), (b) TEM, (c), (d) HR-TEM images of ZnO–CuO nanocomposite.
Download figure:
Standard image High-resolution image3.3. Fourier transform infrared spectroscopy analysis
The FT-IR spectrum of ZnO–CuO nanocomposite is shown in figure 5. To analyse the various functional groups the spectrum was scanned in the range 350–4000 cm−1. The absorption bands appearing at 3412 cm−1 and 1626 cm−1 correspond to (O–H) stretching of water and (H–O–H) bending vibrations respectively. Band at 1105 cm−1 is due to (C–O) bonds of carbon adsorbed on nanocomposite surface. The bands corresponding to lengthening and bending vibrations of (C–H) were observed at 2924 and 1382 cm−1, respectively. In addition, the significant absorption bands observed at 503 cm−1 and 661 cm−1 were attributed to Zn−O and Cu−O stretching vibrations, respectively [48]. Thus, the expected functional groups were confirmed from the results.
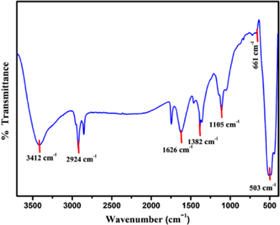
Figure 5. FT-IR spectrum of ZnO–CuO nanocomposite.
Download figure:
Standard image High-resolution image3.4. Diffused reflectance spectroscopy
The optical energy bandgap was estimated using the Kubelka-Munk equation [45].

where, R is the reflection coefficient of the sample. From equation (3) plot of F(R)2 v s−1 photon of energy (eV) gives the optical energy bandgap (Eg) and the same is depicted in figure 6. From the plot, the optical energy bandgap of ZnO–CuO nanocomposite was found to be 3.32 eV. Generally, the bandgap depends on size, compositions/defects and crystallinity. For pure ZnO NPs, the optical energy bandgap is found to be 3.9 eV [49]. In ZnO–CuO nanocomposite, the bandgap shifts towards a lower value due to influence of CuO in ZnO–CuO nanocomposite.

Figure 6. Optical energy bandgap of ZnO–CuO nanocomposite.
Download figure:
Standard image High-resolution image3.5. Photocatalytic studies
The photocatalytic behaviour of green synthesised ZnO–CuO nanocomposite was assessed through the photo-degradation of the MB dye with the aid of visible annular type photoreactor under UV light irradiation. The actual study starts when the light is illuminated on the specimen, the photon of energy is consumed by the semiconducting ZnO–CuO nanocomposite in which the bandgap is higher.
Electrons and hole pairs are created in the conduction and valence band. If the charge carriers are not put together again, then the migration of free electrons on the surface leads to the oxygen reduction resulting in the formation of peroxides and superoxides. These newly generated holes can oxidise water and form OH free radicals. Such radicals are unstable and highly reactive in nature, which eventually leads to the organic dye degradation. Photocatalytic action on dyes is bettered by the influencing factors like phase particle size, morphology, composition, size distribution, surface area, bandgap, etc. The steady decrease in the absorption peak intensity at 663 nm by the time exposed to UV light indicates the dye degradation as shown in figure 8. The degradation efficiency has been calculated using equation (1). The calculated efficiency is found to be 97.93% at 105 min against MB dye [44]. The mechanism of degradation of dye is depicted in figure 7.
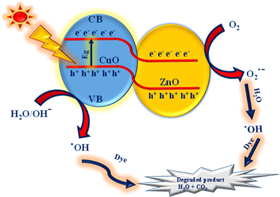
Figure 7. Schematic mechanism for the dye degradation.
Download figure:
Standard image High-resolution image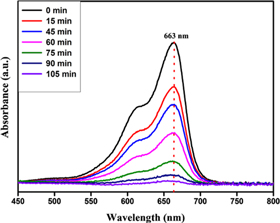
Figure 8. Time dependent absorbance spectrum of synthesised ZnO–CuO nanocomposite against MB dye.
Download figure:
Standard image High-resolution image3.6. Antibacterial studies
Employing agar well diffusion method, the antibacterial nature/character of the synthesised ZnO–CuO nanocomposite was studied in comparison to human pathogenic bacteria Staphylococcus aureus and Escherichia coli. By practice, the antibacterial activity chiefly depends upon the reactive oxygen species (ROS), surface area, particle size, etc. ZnO–CuO nanocomposite generates ROS (hydroxyl, superoxide radical, singlet oxygen, and alpha-oxygen) through the Fenton reaction leading to lipid peroxidation, DNA damage and protein oxidation which can abolish the bacteria, mechanism is depicted in figure 9. The zone of inhibition formed by the ZnO–CuO nanocomposite of known concentrations (500 and 1000 μg μl−1) with reference to the positive control (Ciprofloxacin) has been shown in figure 10 and data is inscribed in table 2. The antibacterial activity of ZnO–CuO nanocomposite shows significant inhibition to both the bacterial strains that are likened to standard antibiotic ciprofloxacin [46].

Figure 9. Antibacterial activity mechanism of ZnO–CuO nanocomposite.
Download figure:
Standard image High-resolution image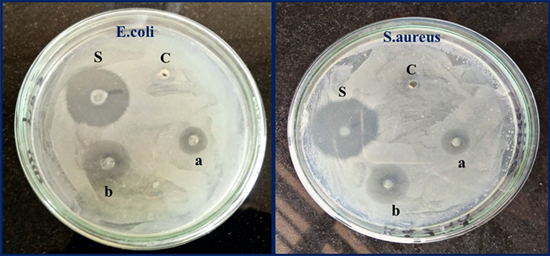
Figure 10. Antibacterial activity of ZnO–CuO nanocomposite against E. coli and S. aureus bacterial strains, (S) Standard antibiotic, (C) control. (a) 500 μg ml−1; (b) 1000 μg ml−1.
Download figure:
Standard image High-resolution image
Table 2. Antibacterial activity of ZnO–CuO nanocomposite on pathogenic bacterial strains.
| No. | Sample | Escherichia coli (mean ± SE) | Staphylococcus aureus (mean ± SE) |
|---|---|---|---|
| 1 | Control | NA | NA |
| 2 | Ciprofloxacin 10 μg ml−1 | 12.43 ± 0.52 | 11.98 ± 0.34 |
| 3 | ZnO –CuO nanocomposite 500 μg ml−1 | 7.69 ± 0.21 | 6.74 ± 0.63 |
| 4 | ZnO –CuO nanocomposite 1000 μg ml−1 | 9.14 ± 0.42 | 8.25 ± 0.19 |
Values are the mean ±SE of inhibition zone in mm, NA symbolises no bacterial activity found in this work.
4. Conclusion
This work illustrates the one-pot green synthesis of ZnO–CuO nanocomposite by solution combustion method using Calotropis gigantea leaf extract as fuel. The hexagonal shaped ZnO–CuO nanocomposite was confirmed by XRD study. Morphology of nanocomposite shows that particles are agglomerated. Elemental compositions (Zn, Cu, O) in prepared nanocomposite were confirmed by EDAX spectrum. HR-TEM images show that nanocomposite is spherical and hexagonal in shape with average particle size of 10–40 nm. FT-IR confirms the presence of organic groups. ZnO–CuO nanocomposite exhibits significant photodegradation for methylene blue dye with 97.93% degradation efficiency. The obtained results confirm that ZnO–CuO nanocomposite shows effective antibacterial activity against human pathogens. In summary green synthesised ZnO–CuO nanocomposite can possibly be used in waste water treatment and biomedical applications.
Acknowledgments
Dr G Nagaraju thanks DST-Nano mission (SR/NM/NS-1262/2013) Govt of India, New Delhi for providing characterisation techniques. Rajith Kumar C R thanks Department of Biotechnology, GM Institute of Technology, Davangere and Siddaganga Institute of Technology, Tumakuru for providing lab facility.