
Abstract
In this work, we present the design, fabrication and characterization of a novel micro-extractor that performs on-line extraction–concentration–detection (ECD) of target molecules flowing in a carrier liquid. The system comprises a primary microchannel containing a flowing aqueous carrier liquid and a secondary organic storage fluid circulating in an adjacent channel. The interfaces between the two immiscible fluids are stabilized by vertical micro-pillars. The system encompasses three functions: (i) extraction of the target molecules from the carrier fluid through the pillar-stabilized interfaces, (ii) concentration of the targets in the secondary organic solvent due to its very low—or zero—velocity and (iii) on-line detection via optical spectrometry. We successively present the analysis of the physics of the system, which has led us to a specific design, then the microfabrication of the chip, and finally we demonstrate the extraction, concentration and detection of lead ions (Pb2+) from a water flow.
Export citation and abstract BibTeX RIS

Content from this work may be used under the terms of the Creative Commons Attribution-NonCommercial-ShareAlike 3.0 licence. Any further distribution of this work must maintain attribution to the author(s) and the title of the work, journal citation and DOI.
1. Introduction
Microfluidic systems have recently brought dramatic improvements to the monitoring of dangerous molecules and/or pathogens in solutions [1]. They allow for the continuous and sensitive detection of these targets in liquids. However, integration of the three key functions required by such systems, namely efficient extraction, sufficient concentration and sensitive detection (ECD), remains a difficult task. In this paper, we present a new prototype of an integrated microsystem based on liquid–liquid extraction. Different principles can be used to realize an integrated system [2–4]. The solution chosen here is that of liquid–liquid extraction (LLE), currently used as a sample preparation technique in environmental analysis or bioanalysis. This method differentiates the compounds based on their affinity for two different immiscible liquids, usually water or water-based (aqueous), and an immiscible organic solvent or organic solution. More precisely, the selective affinity is triggered by the binding on the interfaces of the targets with a hydrophobic ligand contained in the solvent. A solution sometimes found in the literature is an LLE based on the formation of an emulsion by mixation followed by a phase separation process [5]. Since this solution is difficult to integrate into a compact microsystem, we prefer the approach pioneered by Ehrfeld [6] based on the stabilization of the interface between the two liquids. This stabilization is achieved by the presence of micro-pillars upon which the interface is anchored. Because the interfacial area must be large, many interfaces are needed; hence, the contact area between the two liquids is constituted of many pillar-stabilized interfaces. Extraction is realized by the migration of the targets through the interfaces. On the other hand, concentration is achieved by keeping the secondary liquid (solvent) at rest—or flowing at a low speed. Finally, detection is achieved by optically illuminating the solvent channel with a UV-VIS detector.
This type of microsystem covers a wide range of applications, like the monitoring of the presence and concentration of chemical or biological molecules in water. In particular, the application of an ECD device is aimed at the evaluation of the presence of heavy metals in water. Some heavy metals, like lead, mercury and arsenic, are extremely toxic even at very low concentration; others, like copper and zinc, are useful for human metabolism in trace concentrations but dangerous at higher concentration. Macroscopic conventional systems used for the determination of heavy metals in water are inductive coupled plasma-mass spectrometry (ICP-MS), electrothermal atomization atomic absorption spectrometry (EA-AAS) and polarography. However, the use of spectrophotometry or fluorescence associated with the micro scale offers many advantages in terms of simplicity and low cost. Moreover, these methods could be integrated easily into a portable instrument.
2. Experimental
Here, we begin with the presentation of the analysis of the physics that has led us to a specific design. The analysis is followed by finite element methods (FEM) simulation using Comsol multiphysics. The design has been carried out by a specific process of LETI-Minatec. The extraction microsystem is designed and manufactured on a silicon substrate (100 mm wafer) of 525 μm thickness using the traditional techniques for microtechnology on silicon, namely photolithography, DRIE (deep reactive ion etching) and thermal oxidation.
For molecular direct bonding, the microsystem is placed in a vacuum chamber at 23 mTorr. Vapor is injected to activate the surfaces of silicon and glass and a 500 mTorr compression of gaseous FDTS is maintained for 30 min. The linear alkyl chain of monolayer FDTS provides for the hydrophobicity of the surface. The measurements of contact angles and surface tension of the 1 μl water droplets on a silicon or silicon oxide surface with a DIGIDROP BBX equipped with WinDrop software showed that the initial contact angle of the water between 65° and 75° reaches 100–116° after the treatment. Observation of the fabricated device was made using scanning electronic microscopy (SEM) or optical microscopy. Zeiss UV-VIS spectroscopy was used to characterize the lead extraction inside device.
For liquid–liquid extraction, the lead solution (Pb 2+) was prepared from Pb(NO 3)2 99.99% Aldrich Sigma in deionized water (18.2 MΩ cm). In order to fix the pH to 7.4, a HEPES buffer was used at a concentration equal to 10 times that of the lead in water. The VARIAN Cary UV-Screw 300 spectrophotometer and an optical fiber UV-VIS detector of ZEISS were used to monitor the extraction in the wavelength range of 300–700 nm.
3. Results and discussion
3.1. Physical analysis: stability and extraction
Two constraints determine the physical behavior of the system. The first constraint is that the interfaces must be stable and attached to the pillars at all times. Remember that we do not want mixation of the two phases. The second constraint is that the interfacial area must be sufficient to provide an efficient mass transfer. We show here that the first constraint is associated with a maximum length L st of the extraction channel. It is impossible to have interface stability if the length of the extraction channel is larger than L st . Next, we show that the second constraint can also be expressed in terms of a characteristic length L e . It is clear that the longer the extraction channel, the greater the efficiency of extraction. We note L e the length sufficient to obtain the capture of 70% of the flowing targets. The other parameters for sensitivity refer to chemistry, i.e. a good association constant between targets and ligands diffusing in the solvent.
3.1.1. Stability length
It is observed first that the constraints on the interfaces are normal constraints, the tangential constraints being negligible [7, 8]. Hence, the force applied on the interfaces is related to the pressure difference across the interface. When the interfaces are stable, the two microflows evolve independently, like two independent channels. The pressure at location x depends on the pressure drop between x and the outlet of the channel,

The pressure difference across the interface at location x region is then given by
where Q1 and Q2 are the flow rates of aqueous phase and solvent. Taking into account the modification of the Washburn equation for the pressure drop for rectangular channels, the pressure difference across the interface is
where α is the aspect ratio of the rectangular channel between the width w and the depth d; ζ(α) is defined by
The maximum pressure difference that an interface can sustain is derived from Laplace's law. In the case of pillars with sharp edges, it can be shown that pinning conditions lead to the equation

Then, upon substitution of (
In equation (
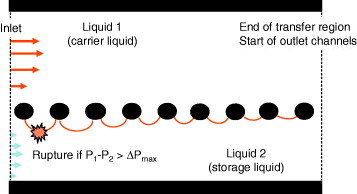
Figure 1 Schematic view of the interface shape and potential breakdown of the interface.
3.1.2. Extraction efficiency
We have developed two different approaches to determine the extraction efficiency: the first method is numerical and we use a Monte-Carlo approach; the second one is an analytical method based on a spatial Fourier series expansion.
In the Monte-Carlo approach, the model is similar to that of the diffusive random walk of particles, except that a convective motion is superposed to the random-walk itself (figures 2 and 3). The analytical model requires some simplifications. First, we assume that the channel has a rectangular shape and that the bottom wall represents a non-interrupted, continuous, rectilinear interface. An order of magnitude of the mass transfer length is given by equating a diffusion time with a convective time. An approximate time for the diffusion of a particle initially located on the other side of the channel to reach the wall—or the interface—is τ d ≈w2 /4D. In this time interval τ d , the particle has been transported by the flow along a horizontal distance L≈Uτ d . We obtain

where D is the diffusion constant and Pe is the Péclet number of the carrier flow. The ratio L/w is also known as the Graetz number.
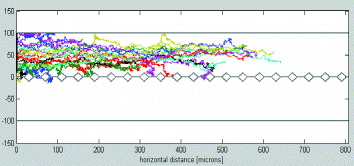
Figure 2 Random walk of particles in a microflow. The pillars have a diamond shape and for simplicity the interfaces are linear segments between pillars.
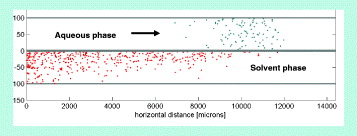
Figure 3 Extraction of targets from an aqueous carrier liquid to a solvent.
However, relation (
Integration of (

Substitution of t with x/U brings back to the fixed Eulerian coordinate system. Numerical simulations have shown that after a very short distance, all of the modes are damped except the first mode corresponding to k=0 (figure 4). The attenuation in the x-direction is then

The number a represents the fraction of targets still in suspension in the carrier liquid at the length x. The fraction of targets transferred to the solvent at length x is then eff=1-a. A reduction of 70% (corresponding to a=8e -1 /π 2) of the number particles continuing to flow in the aqueous channel is reached at the length L e , determined by

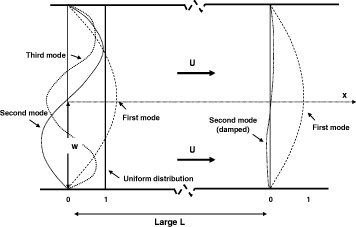
Figure 4 At the inlet, the uniform distribution is decomposed in a spatial Fourier series; after some translation length L, only the first mode remains, all others being damped.
Equation (

which takes into account the ratio of the gap length (or the gap area) to the total length (or the total area) R s =S gap /S tot modified by a geometrical constant that depends on the shape of the pillars R s,eq =κR s . The results were presented in our previous work [9] with R s =1 for an uninterrupted interface. In all other cases, the R s value is 0.22, Q1=0.6 μl min −1, D=10−9 m 2 s −1 and R s,eq receives the values of 0.75 for an ideally thin membrane, 0.52 for lozenges, 0.49 for a thick membrane, 0.43 for circles and 0.28 for square pillars.
The system has to be designed so that the stability length L st is at a maximum. It can be shown that reducing homothetically the dimensions of the pillars and gaps increases the stability length without decreasing the efficiency. In addition, if we aim for an efficiency of 70%, then the dimensions must be chosen so that L e <L st . It can be shown that this inequality requires a limitation on the flow rate and on the dimensions of the channels. In particular, an increase in the etching depth of the channels improves considerably the efficiency of the system. In conclusion, the physical constraints that we have determined were presented in terms of microfabrication constraints.
3.2. Fabrication of micro-extractor
3.2.1. Microfabrication
The microsystem has dimensions of 5×8 mm; channel depth d=150 μm, width w=100 μm and length L=5 mm. The first 80 μm depth etched at the inlets and outlets allows for the insertion of capillary tubes. The second principal etching is used to obtain two adjacent channels of 100 and 150 μm width and 150 μm depth. This etching creates the micropillars too. A cycle of de-oxidations followed by thermal oxidations is used for the final cleaning. The fabrication process is completed by molecular direct bonding and surface treatment by silanisation. The Pyrex top lid is assembled by molecular direct bonding. Capillaries of 75–150 μm diameter and 30 mm length are connected using UV-polymerized Masterbond glue. Devices of different pillar shapes and dimensions are designed on the same 100 mm wafer. The deep reactive ion etching (DRIE) process is realized according to figure 5.
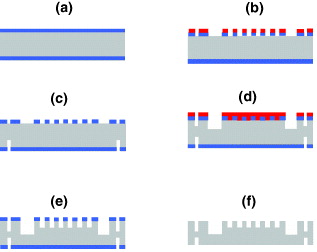
Figure 5 Details of the DRIE process.
A 3 μm oxidation layer is first realized (figure 5(a)); then the wafer undergoes a photolithography step. Deposition of resin is followed by a structuring step and DRI etching of the 3 μm layer of oxide (figure 5(b)), which constitutes the mask for the step (figure 5(c)). The process is repeated for the bottom side of the substrate in order to obtain a 150 μm DRI etching (figure 5(c)), which helps for easier cutting of the device from the wafer. In both cases, the resin is eliminated by treatment with oxygen plasma and a HNO 3 solution. Next, the inlet and outlet ports are made by photolithography and DRIE (figure 5(d)). Finally, a 150 μm DRI etching step creates the pillars (figure 5(e)). A 1% HF solution is used in 1 min to remove the silicon oxide waste on the vertical surface. A total de-oxidation of the plate followed by a thermal oxidation of 100 nm and a second total de-oxidation ensure the cleaning of all of the fluorinated contaminants brought by the DRIE process and produces the final device (figure 5(f)).
Figure 6 shows the scanning electron microscopy (SEM) images of the micro-extractor. After fabrication, a 550 μm thick Pyrex wafer is mounted on the silicon plate by plasma activated direct bonding. The Pyrex top lid is treated by rinsing with a solution of H 2 SO 4:H 2 O 2 to be 2:1 and then by oxygen plasma. The two wafers are wetted and finally are aligned and then heat treated at 400 °C. This process first creates the hydroxyl bridges linking the two surfaces at a distance of 11.54 Å. After that, the bridges switch partially from Van der Waals links to siloxane bonding (Si-O-Si) at 3.18 Å, as shown in the following equation:

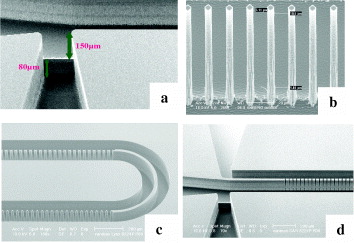
Figure 6 SEM images of the device with two levels of deep etching (a), view of the micropillars (b), a continuous wall can be fabricated so that the channels can make turns (c), view of the channels and pillars: the carrier fluid channel is at the top, the solvent channel at the bottom, and the space for the optical fiber is in the middle (d).
The packaging is achieved by connecting the inlet/outlet fused silica capillaries (Polymicro 150 μm) to the device.
3.2.2. Surface treatment and microfluidic tests
Optimal stability conditions would be obtained if the walls of the aqueous-phase channel were hydrophilic and that of the solvent (organic phase) were hydrophobic. This solution, however, is not practical for MEMS microfabrication. We chose to render the whole system hydrophobic by grafting a suitable monolayer of silane, i.e. perfluorodecyltriclorosilane (FDTS)—CF 3(CF 2)7(CH 2)2–SiCl 3. The silanization is realized at 35 °C in a vacuum chamber (MVD-100). The first step consists of wetting the surface to produce Si–OH bonds and the second step creates Si–O–Si bonds. Using trichlorosilane compound ensures the rate of silanization because the kinetics of Si–Cl is faster than of Si–OMe and Si–OEt, respectively. The silane layer is stable with temperature. The experimental results showed an excellent agreement with the calculation; the stability at the water–air interface can be obtained till 5 μl min −1 (figure 7) and we reached a value of 10 for the water/solvent flow rate ratio. Using the extractor (figure 7(c)) where the solvent is at rest, the 112.5 nl solvent microchamber is used as a spectrophotometric curve.
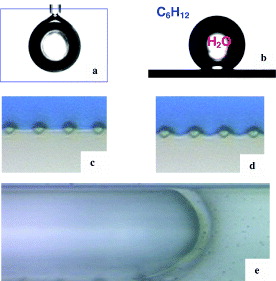
Figure 7 Water droplet hanging in solvent (a), 1 μl water droplet on silanized silicon substrate in cyclohexane (b), water–air interface in non-flowing water: P air =P atm (c) and flow rate of water Q=0.4 μl min −1 (d), the experimental view of the advancing front of water in the channel, confirming the strongly hydrophobic property of the walls (e).
3.3. Liquid–liquid extraction of lead in a microflow
For the test with lead ion, the water is flowing with a maximum flow rate of 2–3 μl min −1, whereas the solvent (chloroform) is at rest. Dithizone (H 2 Dz) molecules are mixed in the solvent in order to extract the lead ions on the interface. The liquids are injected using two syringe pumps (precision 0.1 μl min −1); the inlet of the micro-extractor with the optical fiber aligned with the organic channel, used as a spectrophotometric curve. Our study shows that the optical fiber having a numerical aperture N a of 0.22 rad, and its core radius 55±1.5 μm, could be used for device integration. The solvent is injected first, filling both channels, with a high flow rate Q1=5.0–10.0 μl min −1 in order to remove the air initially present in the micro-extractor. This step is followed by the injection of pure water followed by the water/lead sample at a flow rate Q2=0.1–1.0 μl min −1. The measurement begins when the flow rate of the organic fluid is set to zero and the absorbance is recorded versus time.
The spectrophotometric determination of lead ions uses dithizone as an organic reagent. Dithizone (diphenylthiocarbazone) is a weak acid that dissociates in alkaline media and forms a complex with lead. Dithizone gives a green taint to organic solvents like chloroform (CHCl 3) or cyclohexane (C 6 H 12), due to the HDz- ions. The maximum absorbance of H 2 Dz is located at the wavelength 605–606 nm and the absorption increases linearly with the concentration of H 2 Dz. After reaction with Pb 2+, a pink color appears due to the formation of lead dithizonate complex, which absorbs at a wavelength of 520–525 nm. Hence, the extraction of lead ions produces a new peak of absorption at 520–525 nm. The concentration of the complex is determined by spectrophotometry. Figure 8(a) shows a typical spectrum of liquid–liquid extraction of lead. From the kinetics of absorbance of dithizone and dithizonate, figure 8(b) shows the corresponding concentration kinetics.

Figure 8 Absorbance spectra of dithizone and lead dithizonate obtained from the extraction of 1 ppm Pb 2+ solution by 10 ppm H 2 Dz/CHCl 3 solution (250 scans, 12 scans min −1) at a flow rate of 0.4 μl min −1 (a); kinetics of dithizone consumption and production of lead dithizonate in 1 ppm Pb 2+ solution at 0.6 μl min −1 (b).
The curves are linear until saturation is reached. The slopes indicate the dithizone consumption (-0.0006 AU s −1) and the lead dithizonate production (+0.0003 AU s −1). They satisfy the stoichiometric value of 2. The duration of total extraction was about 20 min. Thus, at the relatively high concentration of Pb 2+ of 1 ppm, we obtained a concentration factor of 4.
4. Conclusions
A new microfluidics system aimed at liquid–liquid solvent extraction has been presented. The action of this microsystem is based on the transfer of targets from a primary aqueous phase to a solvent through liquid interfaces stabilized by vertical micro-pillars. The conception of the system stems from the analysis of the stability of the interfaces and from the physics of transport and diffusion in the aqueous phase. The key of microfabrication is the use of DRIE to obtain a high aspect ratio for the micropillars, followed by a hydrophobic treatment by silanization. It has been shown that the microchip achieves the extraction of lead ions at a concentration of 1–5 ppm using the addition of dithizone in the solvent. Implementation of in-situ detection by an optical fiber UV-VIS detector in order to enhance portability has been carried out successfully.